|
Introduction: The use of biotechnological manufactured drugs, or biologicals, has increased massively over the past few years. Used especially in the treatment of cancer and other severe diseases, biologicals incur high annual therapy costs and represent an additional burden for healthcare systems. Expenditure can be decreased by using cheaper biosimilars, produced following the patent expiration of the reference product. Here we present a model calculation that demonstrates the potential savings from using biosimilars for erythropoietins, granulocyte colony-stimulating factors, and monoclonal antibodies in EU national markets between 2007 and 2020. |
Submitted: 29 June 2012; Revised: 27 September 2012; Accepted: 9 October 2012; Published online first: 11 October 2012
In recent years, the use of biotechnology-derived medicines has increased considerably. These substances, which are generally made using bacteria or cell cultures, are used for a variety of indications, such as anaemia in kidney disease, rheumatoid arthritis and other systemic diseases as well as cancer [1].
The development of biological products is associated with high costs [2, 3]. This, together with the increase in the use of biotechnology-derived medicines, results in high annual treatment costs. In 2008, sales of biopharmaceutical medicines in Europe reached Euros 60 billion [4]. In 2009, sales in the US amounted to almost US$70 billion (around Euros 52 billion) [5]. The considerable cost of biologicals places an additional burden on healthcare systems, forcing cost-cutting measures in other areas of healthcare delivery.
A possible way to reduce spending on biologicals is the use of biosimilars, which can be developed and marketed after the expiration of patents of innovator products. However, due to variations in the manufacturing process, biosimilars differ significantly from chemically manufactured synthetic generic drugs. Whereas traditional generics are pharmacological copies of the original product in terms of qualitative and quantitative composition, biosimilars are produced by synthesis in live cells. As a result, a biosimilar will not have exactly the same composition as the reference product, even if its pharmacological mechanism of action is the same. Consequently, the regulatory requirements for biosimilars are different to those for generics. In Europe, EMA defines biosimilars as biological medicinal products with a mechanism of action similar to already approved biological medicinal products [6].
With regard to their potential for cost savings, the substitution of biosimilars for biologicals is likely to yield lower savings compared to generics, owing to higher development costs. While the price difference between generics and originator drugs may be up to 80% [7, 8], the difference between biosimilars and their reference biologicals is only between 15 and 30% [9–12]. Despite this smaller price difference, it is estimated that a price reduction of just 20% for the five most popular patent-free biologicals could result in annual savings of Euros 1.6 billion across Europe [13]. The use of biosimilars can thus help to reduce healthcare expenditures.
The goal of this paper is to show to what extent biosimilars can make a contribution towards reducing healthcare expenditure in European countries through the increasing use of biosimilars rather than reference biologicals over the long term.
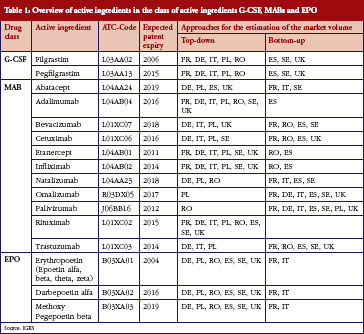
Developing a forecast model with various market determinates, we have created different scenarios to show the potential savings from substituting reference biologicals with biosimilars in eight EU countries (France, Germany, Italy, Poland, Romania, Spain, Sweden, and UK) from 2007 to 2020. We restricted our study to three classes of biologicals: Erythropoietin (EPO) and granulocyte colony-stimulating factors (G-CSF), for which biosimilars are already available, and monoclonal antibodies (MABs).
A summary of the included substances can be found in Table 1.
The analysis is based on quarterly data provided by IMS Health for the eight EU countries (France, Germany, Italy, Poland, Romania, Spain, Sweden, and UK). We selected these countries according to their economic force and their population size: France, Germany, Italy, Spain and UK represent the five biggest EU markets; Sweden is the largest Scandinavian market, while Poland and Romania are the two largest Eastern European markets, based on population size.
Data analysis included the average selling price per standard unit (in US dollars), total sales (in US dollars) and the total quantity (in standard units) of substances in all marketed products per quarter, between first quarter 2007 and third quarter 2010. In addition, information on strength, pharmaceutical form and the name of the manufacturer were used to convert the number of standard units per product to defined daily doses (DDD) per product1.
The total volume for all manufacturers represented the quantity of all administered DDDs per country. After converting the selling price per standard unit to the selling price per pack, we calculated the reimbursement price (for details see section study design, structure and methodology). We used the concept of sales per DDD [14], where the reimbursement prices of all producers per substances and packages were divided by the daily doses per package. We were then able to calculate the expenditure and market-share weighted prices at substance level in combination with the daily doses per package. The EPO group was treated as a single substance. For EPO and filgrastim, we performed separate calculations for reference products (including parallel imports) versus biosimilars.
We used a multi-step process to estimate the cost savings of using biosimilars in the eight EU countries through the different scenarios shown in Figure 1. The individual steps are set out below.

The first step was to estimate the development in future consumption of each substance in each country in DDD until the year 2020 through two approaches.
The first ‘top-down’ approach involved estimating the theoretical medical requirement for the respective country using existing epidemiological literature. We estimated the prevalence, incidence and increase in incidence of individual substances. Our main references were Haberland et al. [15] and the ERA-EDTA Registry Annual Report 2008 [16] for the EPO group, Gratwohl et al. [17] and data of the WHO European Cancer Observatory for the G-CSF group, and Haberland et al. [15], and the WHO European Cancer Observatory for the MABs group, although the latter were more complicated to estimate due to the greater variety of diseases involved (different cancer types or, in the case of TNF-inhibitors, rheumatoid arthritis).
In the second ‘bottom-up’, approach, we updated the current volume development using growth rates over the observed time period. We assumed a slowdown in growth rate compared to the previous period in order to extrapolate the current drug consumption until the year 2020.
We generally preferred the ‘top-down’ approach for its epidemiological basis, but used the ‘bottom-up’ approach for those substances and countries where observed medicine consumption deviated considerably from the consumption modelled by the ‘top-down’ approach. For example, the ‘top-down’ approach underestimates the real consumption figures if the relevant substance is also heavily used outside its primary indication, where no epidemiological data are available. In contrast, there is an overestimation if the prescribing behaviour deviates (whether for medical or economic reasons) from the treatment approach expected ‘in line with the guidelines’.
The decision over which approach to use was based on expert assessments, the healthcare market environment of the relevant European countries, and discussions with national experts, see Figure 1.
The average reimbursement prices for the individual substances were modelled using the manufacturers’ selling prices for biological products (data from IMS Health). In addition, we obtained information on reimbursement prices in each healthcare system through literature research and interviews. We calculated the official gross list prices according to manufacturers’ prices as well as country specific regulations on surcharges for wholesalers and pharmacists and additional taxes. We also considered out-of-pocket payments, regulations on reimbursement restrictions, reductions (either in form of percentile discount or fix reimbursement prices) and price negotiations at hospital level. The reimbursement prices for outpatient and inpatient treatment were calculated separately, with a weighted average price per substance provided by national experts for each country. We applied restrictions in the modelling process: first, we only included regulations that were valid throughout each country; second, we based the calculation of prices in the UK on the regulations for England.
Next, the expected cost for the reference biological drugs in the absence of biosimilars was calculated for each substance and country until the year 2020. This represents the baseline scenario for the case that biosimilars would not enter the market. We then multiplied, for each substance, the expected medicine consumption and the modelled average reimbursement price for the reference biological drug. For the EPO class of substances, and for G-CSF group substance filgrastim, for which biosimilars have been available on the European markets since 2007, we left the prices as they were prior to market approval of biosimilars.
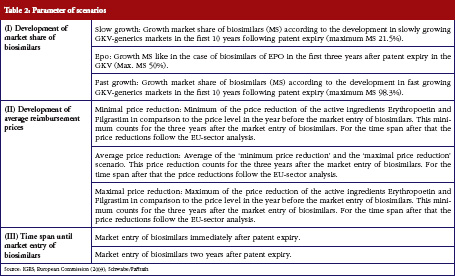
In order to calculate potential savings with biosimilars, we developed country-specific scenarios for the market progression of each substance after biosimilars enter the market.
Different assumptions were made for the development of market shares (I) and the average reimbursement prices (II), of both the reference biological drugs as well as the respective biosimilars. We also developed possible scenarios for market entry of biosimilars once patent protection of the reference biologicals expires (III), see Table 2.
The current development of market shares (I) for the reference biological drug and its corresponding biosimilars were not available for all included substances. In fact, monitoring the development of the market shares of biosimilars over a longer period of time was only possible for the EPO drug class. We therefore had to find a proxy for the possible development of market shares.
We based our scenarios for the development of market shares on the observed market development for selected generic drugs in the outpatient market of the German statutory health insurance scheme (GKV) between 1998 and 2010, see the German report on medical prescribing practices (Arzneiverordnungsreport) for the years 1999 to 2011 [18].
An average was established for specific generic substance markets with slow and/or fast market penetration through generic drugs over a period of ten years2. This provided the baseline for the two scenarios ‘slow growth’ and ‘fast growth’. ‘EPO’, a third, medium scenario, follows the market share development for EPO biosimilars in the outpatient EPO drug market of the GKV.
The different variations for the development of the average reimbursement price (II) for each substance were developed in a two-step process.
First, the observable country-specific development for the EPO class of biosimilars and for filgrastim was used to create three variations in price development for both the reference biologicals and biosimilars. These include the highest, lowest, and average price reduction of reference biologicals and biosimilars for the three years following patent expiry of the relevant biologicals, a situation that is expected to occur following patent expiry. In the first step, we made no assumptions for the price development of EPO and filgrastim, as the real price developments for biosimilars were observable. For the later price developments we chose another approach as further data for the price development of EPO drug class and filgrastim biosimilars were not available due to their late market entry.
In the second step, we based the further price development of all scenarios on the results of the sector inquiry in the market for generic products by the European Commission [19]. These results indicate a slow decline in market prices for generic substances after two years. This price decline was applied to all scenarios starting from year four after market entry of biosimilars.
Our last parameter was the expected time span until the market entry of biosimilars for each substance. We chose two possible variants: first, we expect that biosimilars enter the market immediately after patent expiry, owing to observations on the markets for small molecules, where generic versions enter without delay after the loss of patent protection. Second, following the experiences on the German SHI (Statutory Health Insurance) market for biological substances, we assume that biosimilars enter the market after two years. Again, we made no assumptions for the market entry of EPO class drugs and filgrastim, as their biosimilars were already available in all eight selected countries. We therefore used real market data.
Using combinations of the variants of these three parameters for G-CSF and MABs we created 18 possible scenarios for estimating the possible savings through biosimilars. For EPO we only constructed six scenarios based on actual market data for entry of biosimilars.
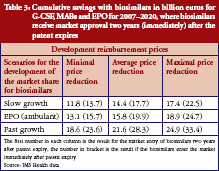
The estimated combined expenditures for all selected countries came to a total of Euros 229 billion between 2007 and 2020, assuming that biosimilars had neither entered the market nor were about to enter in the near future. This therefore represented the baseline from which each saving could be calculated. Table 3 shows the expected cumulative savings for the three investigated classes of biological substances.
By 2020, the expected savings for biosimilars are expected to range from Euros 11.8 billion to Euros 33.4 billion. This equals savings of 5.2% to 14.6% of the estimated expenditures in the selected countries. The values in Table 3 indicate that the development of market share, and time to market entry for biosimilars, have a huge impact on the level of savings.
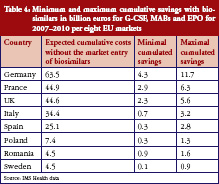
While Table 3 states the level of cumulative savings for the eight EU markets, it misses the distribution of savings between countries, as well as the savings for each individual drug class. The first point is taken care of in Table 4, which shows the minimum and maximum potential cumulative savings for each country.
According to these results, the bulk of savings is expected to occur in France, Germany and the UK. For each of these markets, we expect cost savings through a switch to using biosimilars of at least Euros 2.3 billion. This is not surprising, since these countries also spend the most on biological drugs, with expenditures of more than Euros 44.6 billion expected for the period of 2007–2020 if biosimilars do not enter the markets. The lowest savings are expected for Sweden, due to the country’s market potential and regulations.
There are considerable differences between countries in both the overall savings and the results for each class of substances.
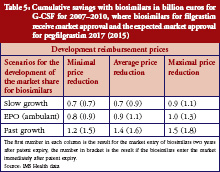
Regarding G-CSF, Table 5 shows that the expected cumulative savings will be between Euros 0.7 million and Euros 1.8 million. We therefore calculated savings of between 5.5% and 15.3%, based on the expected cost volume of Euros 12.0 billion for the two included substances filgrastim and pegfilgrastim. Because biosimilars for filgrastim have been available in the European market since 2008, we have used real rather than fictional reimbursement prices for filgrastim.
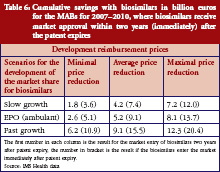
Table 6 shows expected savings from the market entry of biosimilars for monoclonal antibodies of between Euros 1.8 billion and Euros 20.4 billion. With an expected cost volume of Euros 173.3 billion, this means savings of just 1.0% to 11.8%. However, the patent for many substances in this drug class will only expire after the time period investigated for this study. An exception is etanercept, where the first biosimilars could already enter the market by 2012 or 2013, with expected savings of 3.8% to 20.8% based on an expected cost volume of Euros 21 billion. Instead, for other top-selling substances such as rituximab and bevacizumab, it will take until 2020 to achieve significant savings, if biosimilars will enter the market immediately after the patent has expired.
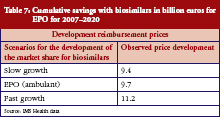
For the EPO drug class, the calculations for savings deviate from the previous methodology, as biosimilars had already received market approval in Europe between 2007 and 2009. Consequently, we were able to use actual post-marketing market share trends. As Table 7 shows, cumulative savings between Euros 9.4 billion and Euros 11.2 billion are expected – subject to the expected market share trend for EPO. The expected savings for the period between 2007 and 2020 will amount to 21.4% to 25.5%, based on expected costs of Euros 43.8 billion without the market entry of biosimilars (baseline scenario).
Our results show considerable potential savings through the use of biosimilars for the investigated classes of biological drugs. We estimate savings of between Euros 11.8 and 33.4 billion, the bulk of which are likely to occur in the national biologicals markets of France, Germany and UK.
With regards to the singular drug classes, the largest potential savings are expected for EPO (between Euros 9.4 and 11.2 billion) and MABs (between Euros 1.8 and Euros 20.4 billion). For the latter, biosimilars for etanercept, rituximab and trastuzumab could save up to Euros 11.3 billion or 14.9% of total expenditure.
The selected scenarios show that especially the immediate availability of biosimilars after the patent expiry of the reference biological drug leads to much higher savings compared to a market entry of biosimilars two years past expiry.
Beside the importance of an immediate market penetration of biosimilars, the associated decline in average price also influences the extent of savings. The effect on the average price due to biosimilars is twofold. First, the average reimbursement price for a substance declines due to cheaper biosimilars. Second, the reference biological drugs also decrease in price. Both effects lead to savings, but the manufacturers of biosimilars do not benefit.
The complexity of the model means that certain limitations must be taken into account when interpreting the results. It was not possible, for example, to consider all current discounts when calculating country-specific reimbursement prices, particularly regional and patient group-specific discounts. For this reason, we frequently employed averages or assumptions based on expert assessments. The complexity of patent laws also means that the expiry of patents for pharmaceutical products is not always straightforward. And for the regulations in the different health systems we assumed a status quo, and could only take future regulatory changes into consideration where they were already announced during the reference period.
The use of generic drug data concerning the development of market shares of biosimilars has to be viewed critically. The future development of biosimilar markets will show if market shares similar to the more optimistic parameter variants ‘fast growth’ are possible.
Our results lead us to make several recommendations for policy makers and regulators. A key difference compared to the markets of small molecule substances is that automatic substitution is not allowed in any EU country. While there are understandable reservations among physicians about the automatic substitution of reference biologicals with biosimilars, a more flexible approach for substitution seems necessary. There are two possible ways to change this situation.
First, the realisation and publication of more head-to-head studies of reference biological drugs and corresponding biosimilars could help to lessen the concerns of physicians. In this context, it also seems important that physicians are informed about the results of these studies. Therefore guidelines or recommendations from Federal Health Institutes and specialist physician associations could be an appropriate way to increase knowledge about the potential benefits of biosimilar substitution.
Second, strict regulations on biosimilar exchange quotas could be used to make the use of biosimilars mandatory. However, this ‘brute-force’ approach would be as a last resort only as protests by physicians seems very likely.
Biological drugs differ from small molecules drugs in relation to their manufacturing process. Instead of being the result of a chemical product process, biologicals are manufactured using genetically modified organisms. Following patent expiry a biological drug can be produced by other companies. These so-called biosimilars inherit similar quality, safety and efficacy to the original biological drug at a lower price level. Therefore, biosimilars can be used to reduce the expenditures for biological drugs in healthcare systems.
Conflict of interest: This report was prepared with the financial support of Sandoz Pharmaceuticals GmbH.
Provenance and peer review: Commissioned; externally peer reviewed.
Christoph de Millas
Ariane Höer, MD
Professor Bertram Häussler, MD
IGES Institut GmbH, 180 Friedrichstraße, DE-10117 Berlin, Germany, www.iges.de
NOTES
1The defined daily dose (DDD) refers to the assumed average quantity of a substance that can be expected for the treatment of a certain condition. The DDD is a unit of measurement for the substances contained in a product and should not be confused with the therapeutic or recommended dose. The DDD was developed, and is maintained by, the World Health Organization (WHO), and adapted for Germany by the Wissenschaftliche Institut der AOK (WIdO).
2Considered generic substance for ‘slow growth’: cyclosporin; considered generic substances for ‘fast growth’: zopiclone, felodipine, ciprofloxacin, paroxetine citalopram, cetirizine, ramipril, simvastatin, lovastatin, gabapentin.
References
1. Roger SD. Biosimilars: how similar or dissimilar are they? Neprology (Carlton). 2006 Aug;11(4):341-6.
2. Ernst & Young. Weichen stellen – Deutscher Biotechnologie-Report 2011, Ernst & Young.
3. Sensabaugh SM. Biological generics: a business case. Journal of Generic Medicines. 2007;4(3):186-99.
4. Covic A, Cannata-Andia J, Cancarini G, Coppo R, Frazao JM, Goldsmith D, et al. Biosimilars and biopharmaceuticals: what the nephrologists need to know–a position paper by the ERA-EDTA Council. Nephrol Dial Transplant. 2008;23(12):3731-7.
5. Hirsch BR, Lyman GH. Biosimilars: are they ready for primetime in the United States? J Natl Compr Canc Netw. 2011;9(8):934-43.
6. Roger SD. Biosimilars: current status and future directions. Expert Opin Biol Ther. 2010;10(7):1011-8.
7. de Joncheere K, Rietveld AH, Huttin C. Experiences with generics. Int J Risk Saf Med. 2002;15(1-2):101-9.
8. King DR, Kanavos P. Encouraging the use of generic medicines: implications for transition economies. Croatian Med J. 2002;43(4):462-9.
9. Blackstone EA, Fuhr JP Jr. Biopharmaceuticals: the economic equation. Biotechnol Healthc. 2007;4(6):41-5.
10. Simoens S. Biosimilar medicines and cost-effectiveness. Clinicoecon Outcomes Res. 2011;3:29-36.
11. Mellstedt H. The future of biosimilars. Hosp Pharm Europe. 2010;49:33-4.
12. Zuniga L, Calvo B. Biosimilars–the way forward. Hosp Pharm Europe. 2010;50:33-4.
13. Oldham T. Strategies for entering the biosimilar market. In: Biosimilars – Evolution or Revolution? London, UK: Biopharm Knowledge Publishing; 2006.
14. Pavcnik N. Do pharmaceutical prices respond to potential patient out-of-pocket expenses? RAND J Econ. 2002;33(3):469-87.
15. Haberland J, Bertz J, Wolf U, Ziese T, Kurth B-M. Zur aktuellen Krebsstatistik in Deutschland. 18. Informationstagung Tumordokumentation der klinischen und epidemiologischen Krebsregister; 2009 Apr 1-3; Jena, Germany.
16. ERA-EDTA Registry [homepage on the Internet]. ERA-EDTA Registry Annual Report 2008, Academic Medical Center, Department of Medical Informatics. [cited 2012 Sep 27]. Available from: http://www.era-edta-reg.org/files/annualreports/pdf/AnnRep2008.pdf
17. Gratwohl A, Baldomero H, Aljurf M, Pasquini MC, Bouzas LF, Yoshimi A, et al. Hematopoetic stem cell transplantation. JAMA. 2010;303(16):1617-24.
18. Schwabe U, Paffrath D, editors. Arzneiverordnungs-Report 1999-2011. Berlin, Heidelberg: Springer Verlag.
19. European Commission [homepage on the Internet]. Pharmaceutical Sector Inquiry: Final Report, Competition DG. 2009. [cited 2012 Sep 27]. Available from: http://ec.europa.eu/competition/sectors/pharmaceuticals/inquiry/staff_working_paper_part1.pdf
|
Author for correspondence: Robert Haustein, IGES Institut GmbH, 180 Friedrichstraße, DE-10117 Berlin, Germany |
If you would like to receive a PDF copy of this manuscript, please send us an email.
Disclosure of Conflict of Interest Statement is available upon request.
Permission granted to reproduce for personal and non-commercial use only. All other reproduction, copy or reprinting of all or part of any ‘Content’ found on this website is strictly prohibited without the prior consent of the publisher. Contact the publisher to obtain permission before redistributing.
Source URL: https://gabi-journal.net/saving-money-in-the-european-healthcare-systems-with-biosimilars.html
Copyright ©2025 GaBI Journal unless otherwise noted.