|
Introduction: Many regulatory authorities have published requirements for the approval of biosimilar medicinal products. However, there is no guidance on which quantitative standards should be used to define how similar a follow-on product must be to be considered biosimilar. Sample sizes for clinical biosimilar trials using traditional designs often exceed 500 patients. Several publications have referenced alternative methods to calculate biosimilar trial sample sizes. Few, however, provide actual case studies showing the order of magnitude change possible. We modelled alternate statistical approaches to practical case studies to test whether it is possible to reduce the sample size of clinical biosimilar trials. |
Submitted: 21 November 2013; Revised: 23 January 2014; Accepted: 28 January 2014; Published online first: 11 February 2014
While regulatory guidance and requirements for developing biosimilars have become more established since the first biosimilar guidance was introduced in September 2005 by the European Medicines Agency (EMA), some ambiguity still exists regarding the methodological approach and rationale used to calculate sample sizes for phase III biosimilar trials. This has led to the investigation of using non-traditional statistical methods for determining the sample size required for demonstrating biosimilarity. EMA defines a biosimilar as a medicinal product which is similar to a biological medicinal product that has already been authorized (the ‘biological reference medicinal product’). The active substance of a biosimilar medicinal product is similar to the one of the biological reference medicinal product. The name, appearance and packaging of a biosimilar medicinal product may differ to those of the biological reference medicinal product. It may also contain different inactive ingredients.’ [1]. The World Health Organization (WHO) and the US Food and Drug Administration (FDA) have similar definitions. However, there is no guidance on specific quantitative standards defining how similar a new product must be to qualify as a biosimilar. EMA and FDA view the development of biosimilar compounds as a stepwise approach that reduces residual uncertainty with each step of the process. Development activities begin with an extensive analytical quality comparability analysis assessing the structural and functional characteristics as well as the manufacturing process and chemistry and manufacturing controls (CMC). Once similarity is established analytically, the compound’s similarity to the reference product is assessed from pharmacologic, safety and efficacy perspectives through the conduct of phase I pharmacokinetic/pharmacodynamics (PK/PD) and phase III clinical studies. Biosimilar clinical development programmes are resource-intensive endeavours from time, cost and patient utilization perspectives. Phase III trials are typically large global studies that may require more than 500 patients and cost millions of dollars. One reason for needing large phase III trials is that conventional statistical approaches used for clinical trial design do not take advantage of the extensive analytical and functional similarity data accumulated in the early stages of the development process. By utilizing Bayesian statistical approaches, prior information can be incorporated into the statistical modelling of the clinical trials to reduce uncertainty and can lead to a significant reduction in the sample size required to demonstrate similarity. In this article, we review novel statistical approaches, including whether the incorporation of structural and functional data into Bayesian statistical modelling can be applied in the clinical setting to reduce the sample sizes required to demonstrate similarity to the reference product.
To determine clinical benefit treatment margins (delta) of bevacizumab and adalimumab, all phase III trials used for regulatory filing (both for FDA and EMA) for the indications of interest were searched. The most prevalent indications and treatments with the highest margins across studies were chosen for the biosimilar development case studies. Margins were calculated by taking the lower 95% confidence interval (CI) of the treatment difference published in each clinical trial. Clinical meaningfulness of the margin was based on clinical judgement determined by the authors based on clinical knowledge, sensitivity of the primary endpoint and variation of the treatment effect across studies.
Biosimilar guidelines were used when applying statistical assumptions, including the FDA guidance for industry on non-inferiority clinical trials, the EMA guideline on the choice of the non-inferiority margin, the EMA guideline on similar biological medicinal products containing monoclonal antibodies/non-clinical and clinical issues, and the FDA guidance for industry on scientific considerations in demonstrating biosimilarity to a reference product [2–5].
Statistical modelling and sample size calculations were performed using PASS version 12 and SAS version 9.2. Repeated measures analysis was performed using the generalized estimating equation method. Sample size and the power of the trials were estimated by simulations. Sample size estimation for the batch-to-batch method follows the methods published by Kang and Chow [6]. Sample size estimation for the Bayesian method was based on a beta-binomial distribution of the posterior distribution of response rate.
Adalimumab biosimilar case study
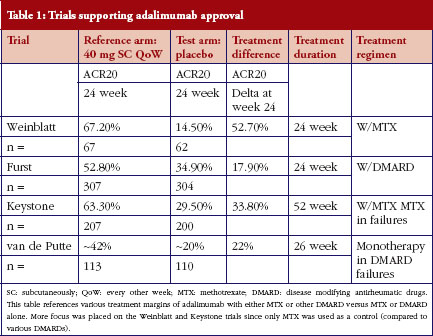
For biosimilar adalimumab, severe, active rheumatoid arthritis was the chosen indication and adalimumab with methotrexate (MTX) was the chosen reference treatment for this case study. The control was EMA-reference adalimumab administered at 40 mg subcutaneously (SC) every other week (QoW) with weekly MTX, while the test arm was biosimilar adalimumab at 40 mg SC QoW with weekly MTX, both given over a 24-week treatment period. All case studies assume a phase III, randomized, parallel, active-reference controlled design. We have seen that the first statistical methodology (‘traditional’) is most often used when designing a phase III biosimilar clinical trial. For the traditional statistical method, the sample size was calculated by analyzing the published literature used to support adalimumab’s approval [7–11]. The primary endpoint chosen was the American College of Rheumatology (ACR) criteria of 20% improvement ACR20 at week 24. A summary of these trials is shown in Table 1. Two trials were chosen from these four (Keystone and Weinblatt) based on similar treatment (MTX and adalimumab) and similar patient populations. The lower bound of the 95% CI of the treatment effect difference between adalimumab + MTX vs placebo + MTX in Keystone and Weinblatt trials are 24.7% and 38.4%, respectively. Sixty per cent of the lowest of the lower bounds (24.7%) would allow for a 15% margin. From a clinical perspective, an equivalence margin of 15% or less is not a clinically meaningful difference based on a meta-analysis of both infliximab and adalimumab trials with a focus on phase III trials. Additionally, subtracting the lower bounds of the 95% CIs of these two trials (38.4–24.7%), leaves 13.7%, which implies an inherent between-trial variability of approximately 15%. Using traditional statistical methods, an equivalence design (recommended by WHO, EMA and FDA guidelines when possible) and a clinical margin of 15%, power, alpha and dropout rate of 80%, 0.05 and 10%, respectively, leads to an overall sample size of 394 (197/arm).
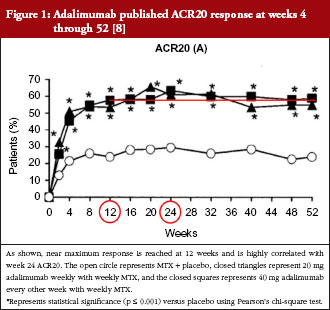
The method above only uses ACR20 at week 24 although ACR20 is measured at multiple time points throughout the trials. To fully utilize collected data to establish biosimilarity, the second method analyses both week 12 and 24 data using a repeated measures analysis. The chosen margin and the statistical parameters (power, alpha, dropout rate, equivalence design) used in the traditional method remain the same. However, the primary endpoint is now two time points of ACR20: 12 weeks and 24 weeks. The assumed ACR20 is 58% at week 12 and 63.3% at week 24. To analyse longitudinal data, the correlation between time points must be modelled based on response retention rate from week 12 to week 24 (approximately 95%) and the proportion of responders who have a first response after week 12 (approximately 13% as shown in Figure 1). Based on historical data from the Keystone trial [8], the correlation coefficient is 0.77. This assumption is based on historical data from 120 and 131 responders at week 12 and week 24, respectively, that six patients will lose response after 12 weeks and 17 will gain a response at week 24. Based upon these assumptions, the sample size required is 350 (175/arm). This is an 11% reduction in sample size from the ‘traditional’ statistical method.
The third method was first described by Kang and Chow [6], where biosimilarity is evaluated using relative distance between ‘follow-on biologics’ and reference biologics (θ = (ub-(ur1+ur2)/2)/(ur1-ur2)), where ur1 and ur2 are the mean response of two batches of reference biologicals, while ub is the mean response of follow-on biologics. This design requires three arms with a randomization ratio of 2:1:1 to the follow-on biologics, batch one of the reference and batch two of the reference compound. The assumed ACR20 rates are 63.3%, 67.2% and 63.3%, respectively. The margin for θ of 3.85 is calculated as 15%/(67.2%–63.3%) to be equivalent to the traditional design margin for proportion difference of 15%. Biosimilarity is established if the 95% CI of θ is within (−δ, δ), where δ is the equivalence margin. The overall sample size required using this method is 620 (310:155:155/arm), which is a 57% increase in sample size.
The fourth method takes a Bayesian approach. The rationale is that before the phase III biosimilar trial is conducted, a large amount of data on reference adalimumab from published results is available. Similarity between the follow-on product and reference adalimumab in preclinical/PK data also is established during early-stage development. To better use this knowledge to reduce the residual uncertainty, the Bayesian method uses prior distribution of ACR20 to represent the prior knowledge and uses observed data to update the estimation. The prior for reference adalimumab can be estimated by meta-analysis using published data. The prior for the follow-on product can be estimated in three steps: 1) building a predictive model of ACR20 of adalimumab using preclinical data (structural and/or functional data); 2) establishing similarity between the follow-on biologic and adalimumab in preclinical data; and 3) using the follow-on biologic’s preclinical data to predict ACR20 with the model used in step one. Since the preclinical data for adalimumab and a follow-on biologic are not currently available to the authors, the model has not been built and validated so far. We provide some hypothetical prior to demonstrate the potential of this method. The assumed prior distribution of ACR20 for reference adalimumab is beta (60.0, 34.8), suggesting the mean ACR20 rate is 63.3% and the probability that the rate is < 55% is 5%. The assumed prior distribution of ACR20 for biosimilars is beta (30.0, 17.4), suggesting the mean ACR20 rate is 63.3% as well and the probability that the rate is < 55% is 12%. When keeping all statistical assumptions the same as the traditional method, the overall sample size is estimated at 290 (145/arm), allowing a 26% decrease in sample size.
Comparing the four methods, the repeated measures method and the Bayesian method yield a reduced sample size compared to the traditional method by incorporating more information both inside and outside the phase III trial, see Table 2. In this case study, the batch-to-batch method resulted in a larger sample size compared to the traditional method.
Bevacizumab biosimilar case study
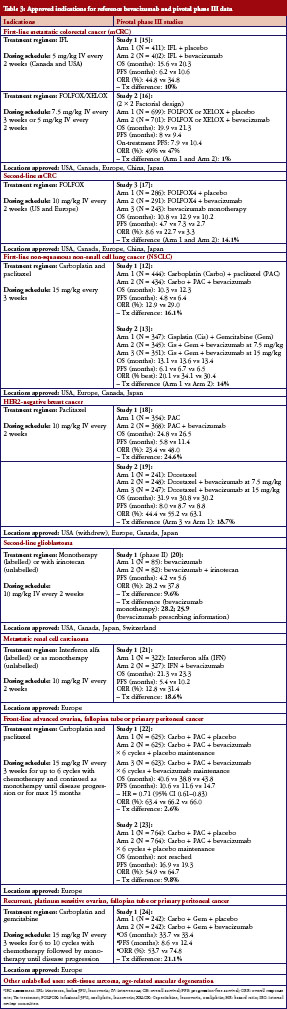
For bevacizumab, first-line advanced/metastatic, nonsquamous, non-small cell lung cancer (NSCLC) was the chosen indication and bevacizumab with carboplatin and paclitaxel was the chosen reference treatment for this case study. The control arm was EMA-reference bevacizumab administered at 15 mg/kg IV with carboplatin IV at AUC 6 and paclitaxel IV at 200 mg/m2 every three weeks, while the test arm was biosimilar bevacizumab at 15 mg/kg IV and the same carboplatin/paclitaxel regimen every three weeks. For the ‘traditional’ statistical method, the sample size was calculated by analysing the published literature used to support bevacizumab’s approval [12, 13]. The primary endpoint chosen was overall response rate following four to six treatment cycles. A summary of these trials as well as bevacizumab data in other approved indications is shown in Table 3. The lower bound of the 95% CI of the trials when pooled is 11.5%. Therefore, a 10% margin is selected based on feasibility, which is smaller than the lower bound (an FDA and EMA regulatory requirement). Due to the small treatment effect with bevacizumab on overall response rate (ORR), a 10% margin may be difficult to justify when approaching regulatory agencies. However, for demonstration purposes, this margin is used for this case study. Based on bevacizumab’s safety profile and dose-response-toxicity relationship, a non-inferiority margin was chosen as opposed to an equivalence design. From a clinical perspective, a non-inferiority margin of 10% is considered acceptable and is not a clinically meaningful difference based on a meta-analysis of both phase III NSCLC trials, as well as clinical knowledge of NSCLC and the variability of ORR.
As with adalimumab, all bevacizumab case studies assume a phase III, randomized, parallel, active-reference controlled design. The assumptions used include a non-inferiority design, a clinical margin of 10% and power, alpha and dropout rates of 80%, 0.05 and 10%, respectively. An assumed ORR of 29% is used based on published data. Using the traditional method, an overall sample size of 706 is required (353/arm).
The second method uses a repeated measures analysis. The chosen margin remains the same. All parameters (power, alpha, dropout rate, equivalence design) remain the same. However, the primary endpoint is now two time points of ORR: cycle two and cycle four. The retention rate from cycle two to cycle four is approximately 97.9% since few patients have a first response after cycle two (or eight weeks). The assumed ORR is 23.5% at cycle two and 29.0% at cycle four. Based on this historical data, the correlation coefficient is 0.84. This correlation coefficient assumption is based on historical data where 104 and 129 respond at cycle two and four, respectively, and two patients lose a response while approximately 27 gain a response, [12] Based upon these assumptions, the sample size required is 684 (342/arm). This is a 3% reduction in sample size from the ‘traditional’ statistical method.
The third method described by Kang and Chow [6], uses a three-arm design with a 2:1:1 randomization ratio. The assumed ORRs are 29%, 29% and 34%. The margin of 1.96 is calculated as 10%/(34.1%-29%) to be equivalent to traditional design margin of 10%. Biosimilarity is established if δ < θ < d, where δ is the clinical margin. The overall sample size required using this method is 1,400 (700:350:350/arm), which is a 98% increase in sample size.
The fourth method takes a Bayesian approach. The prior distribution of ORR for the follow-on biologic was estimated by: 1) building a predictive model of ORR of bevacizumab using preclinical data (structural and/or functional data); 2) establishing similarity between the follow-on biologic and bevacizumab in preclinical data; and 3) using the follow-on biologic’s preclinical data to predict ORR with the model used in step one. The assumed prior distribution of ORR for reference bevacizumab is beta (56,137), suggesting the mean ORR is 29% and the probability that the ORR is < 25% is 11%, and the assumed prior distribution of ORR for the follow-on bevacizumab is beta (28,68.5), suggesting the mean ORR is 29% and the probability that the ORR is < 25% is 19%. When keeping all statistical assumptions the same as the traditional method, the overall sample size is estimated at 500 (250/arm), a 29% decrease in sample size required.
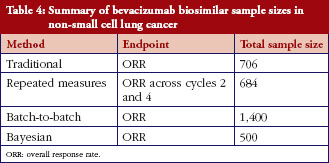
As was the case for adalimumab – comparing the four methods for bevacizumab – the repeated measures method and the Bayesian method result in a reduced sample size compared to the traditional method by incorporating more information both inside and outside the phase III trial, see Table 4. In this bevacizumab case, the batch-to-batch method resulted in a larger sample size compared to the traditional method.
The goal in biosimilar development is to leverage as much information as possible in a stepwise fashion starting with the analytical characterization of the biosimilar compared to the reference product. Following this ‘fingerprint’ analysis, cell-based assays, preclinical evaluation and human pharmacokinetic comparability data are added as evidence to demonstrate biosimilarity. The phase III clinical biosimilarity evaluation is more costly than the total of the preceding phases combined. Therefore, the focus of this article is on calculating phase III sample sizes using different statistical methods in order to improve the feasibility of clinical biosimilar development.
The adalimumab and bevacizumab case studies illustrate several different statistical methods that can be used when planning a biosimilar programme and when approaching regulatory authorities. Principally, the more data that can be leveraged utilizing a ‘totality of the evidence’ approach, the lower the potential sample size of the phase III clinical trial. Using traditional statistical methods advocated by regulatory guidelines for originator compounds, stringent statistical rules must be followed. For example, in order to appropriately calculate a clinical margin, the lower bound of the 95% CI of the treatment difference between the reference product and placebo first must be calculated. One of the most significant covariates in calculating this lower bound is the sample size from the reference trial (meaning the smaller the sample size in the reference trial, the higher the variability on the lower end of the margin, which results in smaller margins for the biosimilar trial). This method is accepted by regulators and is feasible when the treatment margin and the sample size in the reference clinical trial are large. However, if the sample size in the reference trial is small, the lower bound of this 95% CI will be much lower than the treatment margin. This can then result in large and potentially unfeasible sample sizes that may hinder certain biosimilars from being developed. While it is important not to ‘wash out’ the potential for placebo effect, we sought to explore various statistical methods that may enhance the feasibility of biosimilar drug development by reducing sample size while maintaining statistical and scientific rigour.
When leveraging information at multiple time points within the phase III trial by using the repeated measures analysis, the sample size can be reduced, but only modestly (depending on the correlation between the two time points: the lower the correlation between time points, the larger the sample size reduction). The repeated measures analysis assesses data longitudinally, which enhances the dataset and generally results in smaller sample sizes. This method is useful for incorporating a data point occurring early in treatment with data occurring at a later point in time, which enables an early look at clinical activity. By using this statistical methodology, more data is leveraged. However, this is only data that is generated in the phase III clinical trial.
The batch-to-batch reference comparability design method, described by Kang and Chow [6], defines biosimilarity in a different manner than the traditional method. Biosimilarity is established if the difference between the biosimilar and the reference product is not significantly larger than the difference between the reference product and itself (from batch-to-batch). This method is a more intuitive process of defining biosimilarity compared to the traditional method. However, as a non-traditional method this incurs regulatory risk if considering utilizing this design in a global biosimilar programme. An additional hurdle is the lack of availability of published clinical data using different batches. In our case studies, assumptions were made that reflect what would be done in practice. If using this methodology, we strongly advise consulting with regulatory authorities early and often. In both of our case studies, the batch-to-batch methodology resulted in a much larger sample size than the traditional method. This method is likely most practical when the biosimilar of interest has a very small clinical activity margin, where using the traditional method would result in unfeasible sample sizes. Another potential use for this method is when the ‘constancy assumption’ no longer applies due to a shift in standard of care from the time the data from the reference product was published to present day, for example, AT [A = doxorubicin and T = docetaxel] background chemotherapy used in originator filgrastim trials when AC [C = cyclophosphamide] or TAC is now standard. When this occurs, the margin can no longer be calculated and, therefore, this batch-to-batch method may be an option. Using this technique, it is possible to reduce the sample size compared to the traditional method, especially when it can be demonstrated that the reference product has a small within-batch variability but a large between-batch variability on the endpoint of interest. In effect, this approach demonstrates that the biosimilar is as similar as the reference is to itself.
When leveraging both preclinical data and historical data from the reference product, using an informative prior when using Bayesian methodology can lead to significant sample size savings. The rationale is that before the phase III trial is conducted, there is a volume of data already published on the reference product as well as structure/function, preclinical and phase I PK data available on the follow-on biologic. While there is great potential, there also is regulatory risk, especially in phase III development, particularly if Type I error is not adequately controlled. A significant amount of simulation work is required in order to demonstrate that the Type I error rate can be controlled under different circumstances. The Bayesian method may be the most appropriate method to support seamless development and to incorporate the totality of the evidence that is accumulated throughout the biosimilar development programme. In order to utilize this methodology, clients must be willing to approach regulatory authorities with their planning at an early stage.
Another aspect that must be justified is the prior distribution. The sample size is highly sensitive to the prior distribution chosen for the trial. In our case studies, the prior distributions of ORR and ACR20 were for demonstration purposes only and were not based on modelling of actual preclinical data or a comprehensive meta-analysis of historical data. The justification of the chosen prior is critical for regulatory acceptance of this novel methodology as is extensive modelling. New statistical designs and methodology are needed in order to address this issue. While significant sample size savings were demonstrated in the bevacizumab case study, a highly informative prior was used, which available data may not have been able to support. In practice, if a less informative prior is used, the resulting sample size may be larger than the traditional method.
Finally, another Bayesian method that can be used to reduce the overall clinical programme size is the use of Bayesian Hierarchical Model (BHM) by borrowing-of-strength across indications. We have previously shown a 35% reduction (N = 1,214 to N = 790) in phase III clinical programme size for rituximab when a BHM is used (compared to a traditional frequentist method) to support extrapolation between follicular lymphoma and rheumatoid arthritis indications [14]. This assumes identical Type I error rate and power. Since rituximab’s mechanism of action is different between RA and follicular lymphoma, trials in both indications may be required. Therefore, implementing this BHM can be beneficial in reducing overall clinical programme size while supporting extrapolation.
In summary, the clinical margin has the greatest impact on sample size. Various statistical strategies are available and can be applied when developing biosimilars. The most efficient method is to choose the largest clinical margin possible that is deemed not clinically meaningful. Often, the endpoint itself can affect sample size. Using a continuous variable will provide more information than a binary endpoint. In the adalimumab case study, one potential is to use ACR(N) instead of ACR20 at week 12, since this will bring more information into the analysis. Additionally, longitudinal endpoints can provide more information than a single time point as demonstrated in our repeated measures methodology case studies. The single most important determinants of sample size (other than clinical margin) in the various statistical methods are: repeated measures analysis (correlation between time points), batch-to-batch (within-batch and between-batch variability) and Bayesian (prior distribution). Since a biosimilar is not a unique compound, data about the reference product can be leveraged to the biosimilar client’s advantage. Additionally, if comparative data accumulated during the biosimilar programme development – including structural/function, preclinical and PK data – already demonstrates similarity to the reference product, the hurdle in phase III development should not be as high. Therefore, the ‘totality of the evidence’ concept may be leveraged in an objective and justifiable framework when planning the design for the phase III trial in order to facilitate biosimilar drug development and expedite patient access to more affordable biosimilars.
Competing interests: Drs Combest, Healey, Reitsma and Wang are employees of PPD, a global contract research organization. The authors have no conflicts of interest that are directly relevant to the content of this manuscript. This research received no specific grant from any funding agency in the public, commercial or not-for-profit sectors.
Provenance and peer review: Not commissioned; externally peer reviewed.
Austin J Combest, PharmD, MBA
Song Wang, PhD
Brian T Healey, PharmD, MS, MBA, RAC
Dirk J Reitsma, MD
PPD
Wilmington, NC 28401, USA
References
1. European Medicines Agency. Glossary (terms and abbreviations) [homepage on the Internet]. 2014 [cited 2014 Jan 23]. Available from: http://www.ema.europa.eu/ema/index.jsp?curl=pages/document_library/landing/glossary.jsp
2. U.S. Food and Drug Administration. Guidance for industry non-inferiority clinical trials. Draft guidance [homepage on the Internet]. 2013 Mar [cited 2014 Jan 23]. Available from: http://www.fda.gov/downloads/Drugs/…/Guidances/UCM202140.pdf
3. European Medicines Agency. Guideline on the choice of the non-inferiority margin. EMEA/CPMP/EWP/2158/99. 27 July 2005 [homepage on the Internet]. 2005 Aug [cited 2014 Jan 23]. Available from: http://www.ema.europa.eu/docs/en_GB/document_library/Scientific_guideline/2009/09/WC500003636.pdf
4. European Medicines Agency. Guideline on similar biological medicinal products containing monoclonal antibodies – non-clinical and clinical issues. EMA/CHMP/BMWP/403543/2010. 30 May 2012 [homepage on the Internet]. 2012 June [cited 2014 Jan 23]. Available from: http://www.ema.europa.eu/docs/en_GB/document_library/Scientific_guideline/2012/06/WC500128686.pdf
5. U.S. Food and Drug Administration. Draft guidance for industry. Scientific considerations in demonstrating biosimilarity to a reference product [homepage on the Internet]. 2012 Feb [cited 2014 Jan 23]. Available from: http://www.fda.gov/downloads/Drugs/GuidanceComplianceRegulatoryInformation/Guidances/UCM291128.pdf
6. Kang SH, Chow SC. Statistical assessment of biosimilarity based on relative distance between follow-on biologics. Statis Med. 2013;32(3):382-92.
7. Weinblatt ME, Keystone EC, Furst DE, et al. Adalimumab, a fully human anti-tumor necrosis factor alpha monoclonal antibody, for the treatment of rheumatoid arthritis in patients taking concomitant methotrexate: the ARMADA trial. Arthritis Rheum. 2003;48(1):35-45.
8. Keystone EC, Kavanaugh AF, Sharp JT, et al. Radiographic, clinical, and functional outcomes of treatment with adalimumab (a human anti-tumor necrosis factor monoclonal antibody) in patients with active rheumatoid arthritis receiving concomitant methotrexate therapy: a randomized, placebo-controlled, 52-week trial. Arthritis Rheum. 2004 May;50(5):1400-11.
9. Furst DE, Schiff MH, Fleischmann RM, et al. Adalimumab, a fully human anti tumor necrosis factor-alpha monoclonal antibody, and concomitant standard antirheumatic therapy for the treatment of rheumatoid arthritis: results of STAR (Safety Trial of Adalimumab in Rheumatoid Arthritis). J Rheumatol. 2003 Dec;30(12):2563-71.
10. Breedveld FC, Weisman, MH, Kavanaugh AF, et al. The PREMIER study: a multicenter, randomized, double-blind clinical trial of combination therapy with adalimumab plus methotrexate versus methotrexate alone or adalimumab alone in patients with early, aggressive rheumatoid arthritis who had not had previous methotrexate treatment. Arthritis Rheum. 2006;54(1):26-37.
11. van de Putte LB, Atkins C, Malaise M, et al. Efficacy and safety of adalimumab as monotherapy in patients with rheumatoid arthritis for whom previous disease modifying antirheumatic drug treatment has failed. Ann Rheum Dis. 2004;63(5):508-16.
12. Sandler A, Yi J, Dahlberg, et al. Treatment outcomes by tumor histology in Eastern Cooperative Group Study E4599 of bevacizumab with paclitaxel/carboplatin for advanced non-small cell lung cancer. J Thorac Oncol. 2010;5(9):1416-23.
13. Reck M, von Pawel J, Zatloukal P, et al. Phase III trial of cisplatin plus gemcitabine with either placebo or bevacizumab as first-line therapy for nonsquamous non-small-cell lung cancer: AVAil. J Clin Oncol. 2009;27(8):1227-34.
14. Berry SM, Reitsma DJ, Combest AJ, et al. A novel approach to rituximab biosimilar drug development. J Clin Oncol. 2011:29(Suppl; abstr e13064).
15. Hurwitz H, Fehrenbacher L, Novotny W, et al. Bevacizumab plus irinotecan, fluorouracil, and leucovorin for metastatic colorectal cancer. N Engl J Med. 2004;350(23):2335-42.
16. Saltz LB, Clarke S, Díaz-Rubio E, et al. Bevacizumab in combination with oxaliplatin-based chemotherapy as first-line therapy in metastatic colorectal cancer: a randomized phase III study. J Clin Oncol. 2008;26(12):2013-9.
17. Giantonio BJ, Catalano PJ, Meropol NJ, et al. Bevacizumab in combination with oxaliplatin, fluorouracil, and leucovorin (FOLFOX4) for previously treated metastatic colorectal cancer: results from the Eastern Cooperative Oncology Group Study E3200. J Clin Oncol. 2007;25(12):1539-44.
18. Gray R, Bhattacharya S, Bowden C, et al. Independent review of E2100: a phase III trial of bevacizumab plus paclitaxel versus paclitaxel in women with metastatic breast cancer. J Clin Oncol. 2009;27(30):4966-72.
19. Miles DW, Chan A, Dirix LY, et al. Phase III study of bevacizumab plus docetaxel compared with placebo plus docetaxel for the first-line treatment of human epidermal growth factor receptor 2-negative metastatic breast cancer. J Clin Oncol. 2010;28(20):3239-47.
20. Friedman HS, Prados MD, Wen PY, et al. Bevacizumab alone and in combination with irinotecan in recurrent glioblastoma. J Clin Oncol. 2009;27(28):4733-40.
21. Escudier B, Pluzanska A, Koralewski P, et al. Bevacizumab plus interferon alfa-2a for treatment of metastatic renal cell carcinoma: a randomised, double-blind phase III trial. Lancet. 2007;370(9605):2103-11.
22. Burger RA, Brady MF, Bookman MA, et al. Incorporation of bevacizumab in the primary treatment of ovarian cancer. N Engl J Med. 2011;365(26):2473-83.
23. Stark D, Nankivell M, Pujade-Lauraine E, et al. Standard chemotherapy with or without bevacizumab in advanced ovarian cancer: quality-of-life outcomes from the International Collaboration on Ovarian Neoplasms (ICON7) phase 3 randomised trial. Lancet Oncol. 2013;14(3):236-43.
24. Aghajanian C, Blank SV, Goff BA, et al. OCEANS: a randomized, double-blind, placebo-controlled phase III trial of chemotherapy with or without bevacizumab in patients with platinum-sensitive recurrent epithelial ovarian, primary peritoneal, or fallopian tube cancer. J Clin Oncol. 2012;30(17):2039-45.
|
Author for correspondence: Dirk J Reitsma, MD, PPD, Suite 200, 2400 Research Boulevard, Rockville, MD 20850, USA |
Disclosure of Conflict of Interest Statement is available upon request.
Copyright © 2014 Pro Pharma Communications International
Permission granted to reproduce for personal and non-commercial use only. All other reproduction, copy or reprinting of all or part of any ‘Content’ found on this website is strictly prohibited without the prior consent of the publisher. Contact the publisher to obtain permission before redistributing.
Source URL: https://gabi-journal.net/alternative-statistical-strategies-for-biosimilar-drug-development.html
Copyright ©2025 GaBI Journal unless otherwise noted.