|
Aim: To explain the components of pharmaceutical expenditure and illustrate the strengths and limitations of this indicator. In particular, we explore policies applied in European countries that affect the price and volume of medicines. |
Submitted: 10 April 2013; Revised: 7 June 2013; Accepted: 18 June 2013; Published online first: 5 July 2013
Pharmaceutical expenditure is a major indicator used in national and international statistics on pharmaceutical markets and for pharmaceutical policy analyses. Knowledge of pharmaceutical expenditure and its development is of major interest to policymakers and researchers. Baseline information on the status quo of pharmaceutical expenditure is needed to compare with other macroeconomic indicators, such as health expenditure or gross domestic product in a country or region. Pharmaceutical expenditure is also a key indicator in international comparisons. The development of pharmaceutical expenditure at national level or in international comparisons is subject to several analyses, such as assessing the effect of pharmaceutical policies or forecasting future trends [1–8].
Although pharmaceutical expenditure is a standard indicator, worldwide data are not easily accessible. The World Health Organization (WHO) World Medicines Situation Report 2011 [9] devoted an entire chapter to presenting national pharmaceutical expenditure. Data on pharmaceutical spending were extracted from national health accounts where available. Large differences in pharmaceutical expenditure among the regions of the world were confirmed: pharmaceutical expenditure per capita ranged from US$7.61 in low-income countries to US$431.6 in high-income countries in 2005 and 2006, with considerable variation between income groups in each country. On average, 24.9% of total pharmaceutical expenditure was spent on medicines, ranging from 7.7 to 67.6% [9].
The total pharmaceutical bill across the European Union reached more than Euros 190 billion in 2010 [10]. On average, pharmaceutical expenditure accounted for almost one-fifth (19%) of all health expenditure in European Union Member States in 2010, making it the third biggest spending component after in-patient (hospital) and out-patient (ambulatory) care. Pharmaceutical expenditure rose by more than 50% in real terms between 2000 and 2009 in Organisation for Economic Co-operation and Development (OECD) countries, despite negative growth rates in several countries in 2010 [10].
Other major repositories of pharmaceutical expenditure data in high-income countries include the OECD Health database [11] and the Eurostat Health database [12]. The databases are populated by respective Member States according to clear definitions and sound methodologies. In order to reduce the burden of data collection for national authorities, and to increase the use of international standards and definitions in the field of health accounting, increased cooperation between OECD, Eurostat and WHO was agreed for the collection of health expenditure data based on the System of Health Accounts methodology. This resulted in the launch of the Joint OECD–Eurostat–WHO Health Accounts Data Collection [13].
Methodological challenges of health expenditure accounting have been addressed [14–16]. Despite the wide use of pharmaceutical expenditure in science and practice, it is much less of a focus.
In this paper, we explain which components determine pharmaceutical expenditure. In particular, we explore which pharmaceutical policies able to influence price or volume are relevant to the European context. We flag up possible limitations of the pharmaceutical expenditure indicator, and highlight ways to interpret, analyse and compare pharmaceutical expenditure data.
This paper is based on a presentation held at the European Drug Utilization Research Group (EuroDURG)/International Society for Pharmacoepidemiology (ISPE) meeting ‘Better public health through pharmaco-epidemiology and quality use of medicine’ in Antwerp, Belgium, on 1 December 2011. We have since added pharmaceutical policy updates. We have also added further examples, such as price data, not previously included because of time constraints.
Data sources
We present pharmaceutical expenditure data extracted from the major health indicator databases OECD Health Data [11] and Eurostat Health Data [12]. As these data are not fully comprehensive, we have included supplemental data obtained from a primary survey of national authorities. The data-collection exercise was carried out within the framework of the Pharmaceutical Health Information System (PHIS) project [17], established on completion of the PHIS database of indicators to analyse pharmaceutical systems [18].
Updated information for pharmaceutical policy mapping in European countries was provided by the WHO Collaborating Centre for Pharmaceutical Pricing and Reimbursement Policies (Vienna, Austria), to which we are affiliated. This WHO Collaborating Centre has been regularly and systematically collecting pharmaceutical policy information in European countries [19].
We obtained price data from the Pharma Price Information (PPI) service of the Austrian Health Institute [20]. The PPI service provides information on prices of medicines set by European Union Member States, covering all price types. It was established to support, as stipulated in the Austrian General Social Insurance Law [21], the Austrian Pricing Committee located at the Austrian Federal Ministry of Health, which calculates the European Union average price. This average price is required for price setting, as Austria applies external price referencing and bases its prices on the average prices of all other European Union Member States [22].
To ensure clarity of meaning and comprehension, we explain technical terms with reference to the pharmaceutical policy glossary of the WHO Collaborating Centre for Pharmaceutical Pricing and Reimbursement Policies [23]. We also use the terms ‘out-patient care’, i.e. ambulatory care, community care, without hospital out-patient departments, and ‘in-patient’ or ‘hospital care’, as defined in this and other glossaries.
We begin by addressing price components of pharmaceutical expenditure and underlying policies influencing price, and then we present volume components and policies, and the different methodological approaches to measurement units. Different sub-markets that pharmaceutical expenditure may refer to are then analysed, and further methodological limitations are finally discussed.
Official out-patient price types
Pharmaceutical expenditure is determined by a value component and a volume component, i.e. price multiplied by volume in the (sub-)markets in question.
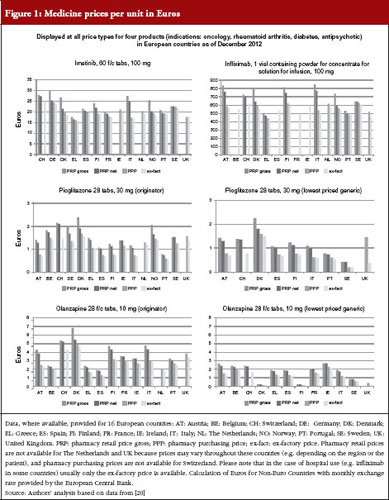
The usual price types for the out-patient sector are as follows:
In some cases, the latter is also referred to as ‘public price’, to indicate the price set for the public, i.e. consumers. We advise not using the term ‘public price’ because it could be misconstrued as a reference to the funding source of a ‘public payer’. The pharmacy retail price (net) can be increased by further add-ons, such as duties and taxes, which results in the pharmacy gross retail price.
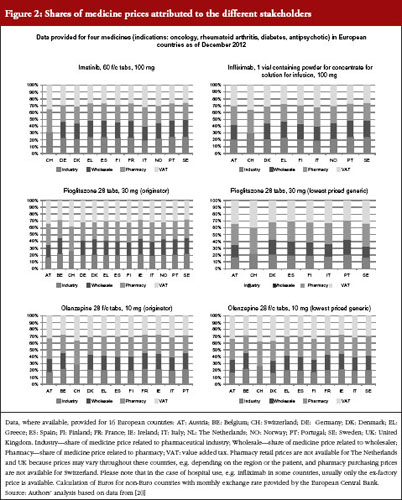
These price types are shown in Figures 1 and 2, with real-life examples for four medicines from different indications (oncology, rheumatoid arthritis, diabetes, antipsychotic); generics are available for two of them. In Figure 1, prices of medicines are presented as unit prices, i.e. the price per tablet or vial, for the different price types in 16 European countries. Existing variations are highlighted among products and countries.
The different price types are attributed to a regulation in place in several high-income countries, including European countries. Medicines, or a large proportion of medicines on the market, are funded by public payers (so-called reimbursable medicines). At the manufacturer level (ex-factory prices), prices of reimbursable medicines are usually statutorily set, i.e. based on a legal act such as a law or decree, and can be negotiated between the state and the manufacturer; sometimes a combination of both procedures is applied. Different methods for setting an ex-factory price can be applied.
A frequently used approach to determine the price of new medicines is external price referencing, i.e. the practice of using the price(s) of a medicine in one or several countries to derive a benchmark or reference price for the purposes of setting or negotiating the price of the product in a given country [23]. As of 2013, 24 out of the 27 European Union Member States (all but Denmark, Sweden and UK) apply external price referencing, at least as a supportive tool, for new medicines [19, 24, 24]. At the same time, generic medicines prices are either set at a specific percentage lower than the price of the generic medicine (‘generic price link’), or countries work competitively to decrease prices, or a mixture of the two [3, 8, 26, 27].
Pharmacy purchasing and retail price types are determined through regulations stipulating maximum remuneration granted to the stakeholders involved in pharmaceutical distribution. Wholesale and pharmacy mark-ups usually apply to all medicines, but are limited to reimbursable and prescription-only medicines in some countries [18, 28]. Some European countries set a medicine price at the pharmacy level and do not have statutory wholesale mark-ups. For those countries, ex-factory prices can, at best, be calculated on the basis of an estimated average wholesale margin. The design of the distribution remuneration in the form of fixed mark-ups or regressive schemes influences pharmacy purchasing and pharmacy retail prices. Several European countries, for example, have opted for regressive wholesale and pharmacy margin schemes, which gradually decrease the mark-ups for high-cost medicines. The share of the price attributable to wholesalers, and particularly pharmacies, tends to be higher for low-price medicines in regressive margin schemes. Pharmacy remuneration may also be designed independently from the price, e.g. by providing a fee for service, such as in The Netherlands or in the UK [1, 3, 28–30].
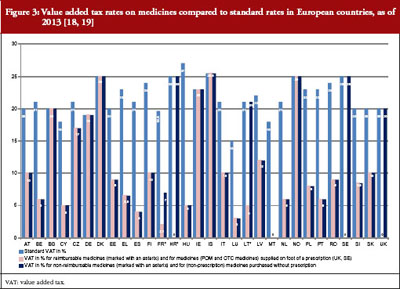
The price of a medicine and, as a result, pharmaceutical expenditure, may be increased by duties and taxes, which are known to account for a considerable part of the medicine price in middle- and low-income countries [31–33]. In European countries, only value-added tax is applied to medicines. Most European countries apply a value-added tax rate on medicines that is lower than the standard rate, see Figure 3. When comparing pharmaceutical expenditure between countries, we strongly advise checking whether data are indicated net or gross.
‘Reimbursed price’ or ‘reimbursement price’ is important for public payers. It refers to the maximum amount covered by public payers (usually social insurance or a national health service) [23]. In European countries, the term ‘reimbursement price’ is not explicitly indicated, except for Austria, which uses the term ‘sickness fund price’. In other countries, the reimbursement price can be derived from the medicine price, usually the pharmacy retail price, by deducting the percentage of co-payments incurred by the consumers. Most European countries (all European Union Member States except Austria, Germany, Italy, The Netherlands and UK [29, 30]) ask the patient to co-pay a specific percentage of the medicine price: specific medicines, whose therapeutic (added) value was assessed to be lower compared with essential or life-saving medicines, are not fully funded by the public payers, but they are reimbursed to a specific extent. For instance, if the pharmacy retail price is Euros 100 and the reimbursement rate is 80%, then the reimbursement price amounts to Euros 80.
In this case, the patient is required to co-pay Euros 20 plus a prescription fee, if applicable, unless they are exempted from co-payment or are granted reduced co-payment.
A particular reimbursement price is called the reference price. A reference price system is a reimbursement system in which identical or similar medicines, e.g. originator medicines and generics, are clustered to a reference group, and a public payer defines the maximum price (amount) that is reimbursed for all medicines clustered to this group [23, 34]. A reference group can be clustered for the molecule (Anatomical Therapeutic Classification [ATC] Level 5), the class (ATC Level 4) or the therapeutic area (ATC Level 3) [35]. The patient is required to pay the difference between the reference price and the pharmacy retail price, plus any further co-payments, e.g. in Portugal, the percentage co-payment is also applicable to the reference price [36]. As of 2013, 20 European Union Member States have a reference price system in place [19], and Ireland decided in May 2013 to introduce it.
Price studies can be carried out for each of these price types, or a combination of them. It depends on the perspective of the analysis and which price type is selected.
Official in-patient price types
Hospitals are usually directly supplied by the pharmaceutical industry and, in some cases, by wholesalers [37, 38]. In contrast to the out-patient sector, only one official price type is applicable for the in-patient sector, and that is the ‘official hospital price’. It generally corresponds to the ex-factory price or, in the case of delivery by a wholesaler, to the wholesale price, which includes the wholesale mark-up.
Discounted prices
Discounted prices are known from the hospital sector. Large discounts and rebates are offered on specific medicines to the hospitals. In some European countries, cost-free medicines are permitted, so hospitals obtain medicines at a price of zero Euro. Discounts and rebates, including a cost-free supply, have been observed, particularly for medicines, where competitors have come onto the market, and whose use might be required for long-term treatment [37, 39]. As a result, the actual hospital price is of greater relevance than official hospital prices, as the hospital’s pharmaceutical bill is composed of what the hospital actually spends on medicines.
Discounted prices also play a role in the out-patient pharmaceutical sector. Along the supply chain, e.g. from wholesaler to pharmacies, from pharmacies to consumers, discounts can be granted, if not forbidden by law. Legal provisions may specify the maximum amount of discounts and rebates granted. In France, for example, pharmacies are permitted to obtain a maximum discount of 2.5% on reimbursable medicines from wholesalers, whereas the limit is 17% for reimbursable generics [40].
Furthermore, discounts and rebates granted to public payers are less well known, but have increasingly been gaining importance. According to a survey of European countries [41], discounts and rebates are granted to public payers by pharmaceutical companies in 25 of the 31 European countries surveyed (out-patient sector in 21 countries and in-patient sector in all 25 countries). The most common discounts and rebates are price reductions and refunds linked to sales volume, but types such as in-kind support, price-volume and risk-sharing agreements are also in place. A mix of various types of discounts and rebates is common. Risk-sharing and further managed-entry agreements that attempt to manage uncertainty are on the rise in several European countries, such as UK (patient access schemes), Italy, Poland and the Baltic States [42, 43].
Volume measurement and analysis
Different methodological approaches can be applied to measure utilization. Pharmaceutical utilization can be assessed by the number of medicine packs sold, dispensed, or actually consumed by patients. Sales data can also be indicated by ‘Standard Units’, which are defined as the smallest doses of a product, equivalent to one tablet or capsule for an oral dosage form, one teaspoon, i.e. 5 mL, for a syrup, and one ampoule or vial for an injectable product [44].
A major discipline dealing with the volume component is drug-utilization research, which WHO has defined as ‘the marketing, distribution, prescription, and use of drugs in a society, with special emphasis on the resulting medical, social and economic consequences’ [45]. From a public health perspective, a major aim of drug-utilization research is to enhance a more rational use of medicines by ensuring that patients receive ‘medications appropriate to their clinical needs, in doses that meet their own individual requirements for an adequate period of time, and at the lowest cost to them and their community’ [46]. Drug-utilization research describes patterns of pharmaceutical use, indicates early signals of irrational use of medicines, assesses interventions to improve the use of medicines, and benchmarks the use of the medicines in different populations [45]. This discipline has contributed greatly to statistics, and a measurement unit (Defined Daily Dose [DDD]) was developed to allow international comparisons of volume data to be made: the DDD is defined as the average maintenance dose of the medicine when used on its major indication in adults [47]. Today DDD is a standard measurement for pharmaceutical consumption; drug-utilization research would not be possible without it.
From a public payer’s perspective, the ‘items prescribed’ tend to be a focal point of analyses, as prescriptions are likely to be monitored. For this purpose, the relevant scientific measurement unit, again developed to allow comparisons to be made, is the ‘Prescribed Daily Dose’ [PDD]. It is defined as the average daily dose prescribed, as obtained from a representative sample of prescriptions [45]. The number of items prescribed might differ from the number of items actually dispensed, as not all prescriptions might be filled. It is more difficult to obtain information on the number of items dispensed [18].
Volume control policies
In European countries, volume control policies are usually targeted at medicines prescribed by physicians, and therefore prescribers are the key target group of this measure. Furthermore, demand-side measures can also be targeted at patients and pharmacists [48, 49].
In some European countries, such as the Czech Republic, Latvia, Slovakia, UK, and some regions in Spain, and Sweden, pharmaceutical budgets for prescribers are in place [19, 50–52]. Budgets can be combined with financial incentives. For example, in Ireland, doctors were permitted to plough back some of their savings into their practice under the ‘Indicative Drug Target Scheme’; this financial incentive was, however, subsequently scrapped [53]. Where budgets are exceeded, penalties may be imposed, e.g. Latvia. In the 1990s pharmaceutical budgets of countries such as France, Germany and Italy yielded the savings forecast during the first year but not in subsequent years. Sanctions were imposed but could not be executed, partly because of court proceedings. Eventually, the budgets were abolished [54].
Physician prescription patterns are routinely monitored in all European countries [1, 50] to assess volume and quality of prescribing. For instance, public payers check whether doctors prescribe less expensive generics, write prescriptions by International Nonproprietary Name (INN), or both, if that is the policy in place. Prescription monitoring has been implemented in different ways and to differing extents in Europe, and also depends on the electronic support system in place. The Danish electronic monitoring system, ‘Ordiprax’, is considered to be an example of good practice. Ordiprax allows the authorities to assess pharmaceutical consumption at the level of the prescribing doctors and at aggregated local and central levels. Doctors also have access to the Ordiprax system and can compare their prescription pattern to the average of other physicians in the region [55].
Some European countries supplement their prescription monitoring by specific agreements with physicians. For example, physicians are financially rewarded for prescribing a specific target within a therapeutic class, such as statins of generics, and less expensive medicines in France [56]; doctors in Belgium have to prescribe a minimum target of ‘non-expensive medicines’ whose exact amount depends on their medical specialisation [57, 58]. Further, prescriber information also plays a major role [59]. In France, sickness fund representatives (Délégués de l’Assurance Maladie) visit physicians to provide feedback on their prescribing activity and to inform them about campaigns [40].
The patient is another key target group, and several European countries have targeted campaigns at patients [1, 50, 59]. Although these measures might have contributed to containing public pharmaceutical expenditure, the primary aim was to encourage a more rational use of medicines. Well-known examples are the antibiotics campaign in France and Italy, and generics campaigns in France and Portugal [35, 50].
Initiatives aimed at increasing generics uptake play an important role because pharmaceutical expenditure can be reduced by using lower priced medicines, where available, instead of expensive originator medicines. Key policies to encourage generics use have been devised for different stakeholders: prescribers (INN prescribing), pharmacists (generics substitution) and patients (campaigns to raise awareness about the role and benefits of generics). At the beginning of 2013, 22 out of the 27 European Member States had generics substitution in place, and 23 allowed INN prescribing [19, 34]. In recent years, Lithuania and Slovakia, for example, decided to switch from voluntary to obligatory INN prescribing [19, 60, 61] on the basis that previous voluntary policies had not been fully enforced and tended to be less successful in achieving planned outcome than mandatory policies [1, 36]. On the other hand, high generics uptake has been achieved in the UK with voluntary INN prescribing, and a decision was made against the introduction of generics substitution planned for 2010 following a public consultation [34, 62, 63].
An econometric model has been used in 12 European countries to assess the relevance of different volume components that influence pharmaceutical expenditure. The study concluded that the following three volume control policy measures had significantly decreased pharmaceutical expenditure: an electronic prescribing system; pharmaceutical budgets; and, with some delayed effect, the introduction of generics substitution [64].
As discussed, price and volume components influencing pharmaceutical expenditure have to be considered when analysing pharmaceutical expenditure. An increase in pharmaceutical expenditure resulting from the ‘price effect’ might be attributable to market entry of new expensive medicines, and ‘volume effect’ can be linked to demographic developments, such as an ageing population.
Further methodological challenges need to be addressed, including the scope of pharmaceutical expenditure.
Total pharmaceutical expenditure and sub-markets
Pharmaceutical expenditure may refer to the total market or to specific sub-markets. Major distinctions are public and private pharmaceutical expenditure, and out-patient and in-patient pharmaceutical expenditure.
Pharmaceutical expenditure from these sub-markets should ideally amount to total pharmaceutical expenditure. Other relevant sub-markets include the generics market, the prescription medicines market, the over-the-counter market, and the self-medication market. Expenditure data for a sub-market might be available for another sub-market, e.g. out-patient, only. For instance, pharmaceutical expenditure spent on generics is likely to be indicated only for the out-patient sector, for those medicines reimbursed by social health insurance, or both, because of limited data for other segments.
These gaps in data availability are also relevant to public/private pharmaceutical expenditure, and particularly out-patient/in-patient pharmaceutical expenditure. Some countries might have difficulties in indicating private pharmaceutical expenditure, or all components of it. Private pharmaceutical expenditure typically includes expenses of private households for non-reimbursed medicines, co-payments to reimbursable medicines, including co-payments under the reference price system, and expenses for medicines, which are, in principle, reimbursable but can be borne out-of pocket by the patient in specific cases; this may be because the price of the medicines is lower than the prescription fee. Although data for public pharmaceutical expenditure can easily be derived from the payers’ databases, separate data collection and assessment for private expenditure might be required. For instance, Bulgaria provides no information on private pharmaceutical expenditure, and what is indicated as total pharmaceutical expenditure in databases such as Eurostat is in fact public expenditure only.
Hospital (or in-patient) pharmaceutical expenditure is even more difficult to collect. It is not routinely surveyed at national levels. This is attributable to the financing system in European countries: pharmaceutical expenditure in hospitals are usually funded by hospital budgets [37]. As a result, what is indicated in the standard databases as total pharmaceutical expenditure refers, in practice, only to out-patient pharmaceutical expenditure. The definition of ‘hospital’ is challenged, as hospitals may also include hospital out-patient departments [23].
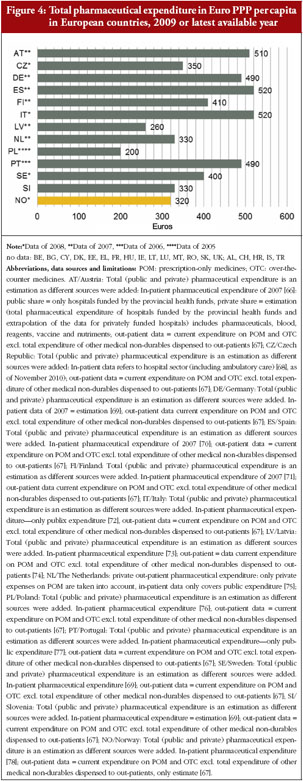
Data for total pharmaceutical expenditure in European countries as of 2009 are presented in Figure 4. For out-patient pharmaceutical expenditure, we referred to OECD health data [11]; if these were unavailable, Eurostat was used [12]. For hospital pharmaceutical expenditure, we conducted a separate survey. We asked competent authorities to provide hospital pharmaceutical expenditure data, or an estimate, for their countries. Some countries were able to provide the data; however, extra effort was required in most countries because the data were not easily available [18, 37]. Although we aimed to produce a complete picture for all 27 European Union Member States, representatives of several countries failed to provide these data, despite their efforts. Methodological difficulties and limitations are presented in Figure 4.
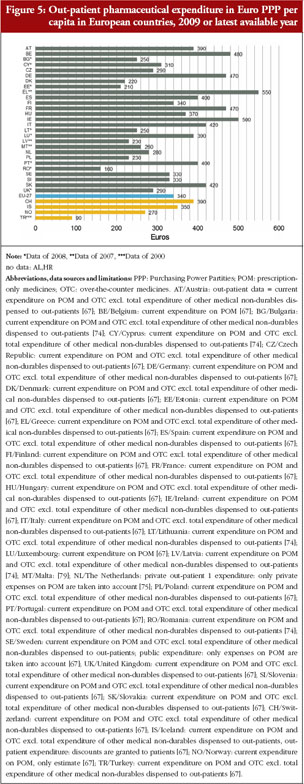
Out-patient pharmaceutical expenditure per inhabitant in European countries is shown in Figure 5. Here, a higher number of countries was able to provide data. In many cases, information on out-patient pharmaceutical expenditure was misinterpreted as total pharmaceutical expenditure, see Figure 5.
In addition, national pharmaceutical expenditure data cover expenditure for pharmaceuticals and further medical devises.
Other methodological challenges
Inter-country comparisons of pharmaceutical expenditure pose methodological challenges, specifically exchange rates and a possible weighting for the different economic situations of the countries. For the latter, use of the power purchasing parities (PPP) can eliminate the effects of differences in price levels between countries, thus reflecting the relative price level in relation of the purchasing power of a country [23, 65]. OECD, for instance, uses the PPP concept in their Health database, and they indicate pharmaceutical expenditure and other monetary indicators in US dollar PPP. In the European context, the use of Euros PPP would be preferred to US dollar PPP.
Another challenge is analysing the development of pharmaceutical expenditure over the years. It may be that the methodological approach applied to pharmaceutical expenditure data, even from the same source, might have changed at a particular time point for various reasons. This can explain breaks in the data series.
Finally, we would like to highlight the use of recent data. Many countries first publish preliminary expenditure data, based on estimations, and will ‘correct’ this estimate a few months later when all required data are available.
In this paper, we are not advising against the use of pharmaceutical expenditure data. Use of pharmaceutical expenditure data for analyses, and as a basis for policy decisions, is highly recommended despite limitations in the data sets. We must be aware of these limitations, however, and consider them when interpreting the data. As a minimum requirement, we advise checking the detailed notes accompanying the data set. One example is a note from the 2012 OECD Health at a Glance study: Pharmaceutical expenditure covers spending on prescription medicines and self-medication, often referred to as over-the-counter products. In some countries, the data also include other medical non-durable goods (adding approximately 5% to the spending). The expenditure also includes pharmacists’ remuneration when the latter is separate from the price of medicines. Pharmaceuticals consumed in hospitals are excluded (their inclusion would add another 15% to pharmaceutical spending approximately). Final expenditure on pharmaceuticals includes wholesale and retail margins and value-added tax [10]. The explanation is long but precise, and assists in understanding the coverage, quality and limitations of the data set.
In this paper, we show that pharmaceutical expenditure is influenced by several price and volume components. Therefore, policymakers are strongly recommended to focus on all aspects rather than on a single policy if they want to contain expenditure.
The interpretation and analysis of pharmaceutical expenditure can be compromised by limited availability of expenditure data in some segments. In some countries, pharmaceutical expenditure data refer to the public sector only. A particular challenge is the collection of hospital pharmaceutical expenditure which, as a rule, has not been routinely surveyed. What is presented under the heading ‘total pharmaceutical expenditure’ in many databases reflects only the out-patient sector. Research projects, such as PHIS, which aimed to fill gaps in data availability, provided valuable contributions to the evidence base.
Pharmaceutical expenditure is a major macroeconomic indicator for pharmaceutical and health-policy analyses. We support the use of this indicator but strongly advise studying which components are included in the given data set of pharmaceutical expenditure, and which are not, and considering the limitations appropriately in the analysis.
It is key for patients that policy makers base their decisions about policy measures on sound evidence. Pharmaceutical policy analysis is a major supportive tool for policy making. Analyses and forecasts, however, may be impaired by limitations in availability and comparability of data.
Although we acknowledge the perils of the pharmaceutical policy analyses as a result of methodological limitations and gaps in data availability, it should not defer us from undertaking such studies. Researchers and policy makers, however, are strongly advised to take caution when interpreting the data. In this study, we examined the components of pharmaceutical expenditure, which is a key indicator, and explored its pitfalls and limitations. By raising awareness and increasing knowledge of this indicator, we intend to contribute to better understanding and more careful interpretation of pharmaceutical expenditure data. This eventually benefits society as a whole, including patients.
We would like to thank the organizers of the EuroDURG/ISPE meeting ‘Better public health through pharmaco-epidemiology and quality use of medicine’ in Antwerp, Belgium, from 30 November to 3 December 2011, and particularly Dr Brian Godman, organizer of the session ‘Exploring units of expenditure in drug utilization studies’ on 1 December 2011 for inviting Dr Vogler to present on pharmaceutical expenditure and suggesting a paper based on the presentation.
We would like to thank our colleagues at the WHO Collaborating Centre for Pharmaceutical Pricing and Reimbursement Policies for surveying updated information on pharmaceutical policies. We also thank the members of the Pharmaceutical Pricing and Reimbursement Information (PPRI) network (http://whocc.goeg.at/Networks/ListOfMembers) for regularly providing information about changes in pharmaceutical policies in their countries. Further thanks go to the Pharma Price Information (PPI) service at the Austrian Health Institute for sharing price data.
The authors received no specific funding for this manuscript.
Competing interests: None.
Provenance and peer review: Not commissioned; externally peer reviewed.
Nina Zimmermann, MA
Claudia Habl
WHO Collaborating Centre for Pharmaceutical Pricing and Reimbursement Policies, Health Economics Department, Gesundheit Österreich GmbH (Austrian Health Institute)/Geschäftsbereich ÖBIG, 6 Stubenring, AT-1010 Vienna, Austria
References
1. Vogler S, Habl C, Leopold C, Rosian-Schikuta I. PPRI Report. Vienna: Gesundheit Österreich GmbH/Geschäftsbereich ÖBIG; 2008.
2. Rosian I, Antony K, Habl C, Vogler S, Weigl M. Benchmarking pharmaceutical expenditure. Cost-containment strategies in the European Union. Vienna: Österreichisches Bundesinstitut für Gesundheitswesen (ÖBIG); 2001.
3. OECD. Pharmaceutical pricing policies in a global market. Paris; 2008.
4. Carone G, Schwierz C, Xavier A. Cost-containment policies in public pharmaceutical spending in the EU. Brussels: European Commission, Directorate-General for Economics and Financial Afairs, 2012 [cited 2013 Jun 7]. Available from: http://ec.europa.eu/economy_finance/publications/economic_paper/2012/
pdf/ecp_461_en.pdf
5. Aaserud M, Dahlgren A, Kosters J, Oxman A, Ramsay C, Sturm H. Pharmaceutical policies: effects of reference pricing, other pricing, and purchasing policies. Cochrane Database Syst Rev. 2006;(2):CD005979.
6. Austvoll-Dahlgren A, Aaserud M, Vist G, Ramsay C, Oxman AD, Sturm H, et al. Pharmaceutical policies: effects of cap and co-payment on rational drug use. Cochrane Database Syst Rev. 2008;(1):CD007017.
7. Toumi M, Rémuzat C. EU Pharmaceutical expenditure forecast. Paris: Creativ_Ceutical. 2012.
8. Kanavos P, Vandoros S, Irwin R, Nicod E, Casson M. Differences in costs of and access to pharmaceutical products in the EU. Brussels: European Parliament, 2011.
9. Lu Y, Hernandez P, Abegunde D, Edejer T. The world medicines situation 2011—medicine expenditures. World Health Organization, Geneva. 2011.
10. OECD. Pharmaceutical Expenditure. In: Health at a glance: Europe 2012: OECD Publishing; 2012.
11. OECD. Health Data. Paris: OECD.
12. Eurostat. Eurostat Health Database.
13. OECD. Joint OECD-EUROSTAT-WHO Health Accounts Data-Collection Initiative Launched. OECD Health Update. 2006;2(2).
14. Gerdtham UG, Jönsson B. International comparisons of health expenditure: theory, data and econometric analysis. Handbook of Health Economics. 2000;1:11-53.
15. OECD. Health care reform. Controlling spending and increasing efficiency. Paris; 1994.
16. Or Z. Determinants of health outcomes in industrialised countries: a pooled, cross-country, time-series analysis. 2000. Report No:0255-0822.
17. Hoebert J, Mantel-Teuwisse A. PHIS Evaluation Report. Utrecht: Pharmaceutical Health Information System (PHIS); 2011.
18. PHIS. PHIS (Pharmaceutical Health Information System) database. [cited 2013 Jun 7]. Available from: https://phis.goeg.at/index.aspx?_nav0029
19. WHO Collaborating Centre for Pharmaceutical Pricing and Reimbursement Policies. Pharmaceutical policy monitoring exercise with national competent authorities representated in the PPRI (Pharmaceutical Pricing and Reimbursement Information) network. Bi-annually, latest update: February 2013 (unpublished).
20. Gesundheit Österreich GmbH (Austrian Health Institute). Pharma Price Information (PPI) service. [cited 2013 Jun 7]. Available from: www.goeg.at/en/PPI
21. General Social Insurance Act § 351c, Federal Law No. 189/1955, latest change by Federal Law I No. 398/2011. 2012. German.
22. Bundesministerium für Gesundheit. Regelung für die Vorgehensweise der Preiskommission bei der Ermittlung des EU-Durchschnittspreises gemäß § 351c Abs. 6 ASVG. 1 January 2008.
23. WHO Collaborating Centre for Pharmaceutical. Pricing and Reimbursement Policies. Glossary of pharmaceutical terms. 2011. Available from: http://whocc.goeg.at/Literaturliste/Dokumente/MethodologyTemplate/PHIS%20Glossary_UpdatedApril2011.pdf
24. Leopold C, Vogler S, Mantel-Teeuwisse AK, de Joncheere K, Leufkens HG, Laing R. Differences in external price referencing in Europe-A descriptive overview. Health Policy. 2012;104(1):50-60.
25. Leopold C, Mantel-Teeuwisse AK, Seyfang L, Vogler S, de Joncheere K, Laing RO, et al. Impact of External Price Referencing on Medicine Prices–A Price Comparison Among 14 European Countries. Southern Med Review. 2012;5(1).
26. Vogler S. How large are the differences between originator and generic prices? Analysis of five molecules in 16 European countries. Farmeconomia Health economics and therapeutic pathways. 2012;13(Suppl 3):29-41.
27. Godman B, Bucsics A, Burkhardt T, Haycox A, Seyfried H, Wieninger P. Insight into recent reforms and initiatives in Austria: implications for key stakeholders. Expert Rev Pharmacoecon Outcomes Res. 2008;8(4):357-71.
28. Kanavos P, Schurer W, Vogler S. Pharmaceutical distribution chain in the European Union: structure and impact on pharmaceutical prices. London/Vienna: EMINet/LSE/GÖG; 2011.
29. Vogler S, Habl C, Bogut M, Voncina L. Comparing pharmaceutical pricing and reimbursement policies in Croatia to the European Union Member States. Croat Med J. 2011;52(2):183-197.
30. Vogler S. Preisbildung und Erstattung von Arzneimitteln in der EU—Gemeinsamkeiten, Unterschiede und Trends. Pharmazeutische Medizin. 2012;14(1):48-56.
31. Cameron A, Ewen M, Ross-Degnan D, Ball D, Laing R. Medicine prices, availability, and affordability in 36 developing and middle-income countries: a secondary analysis. Lancet. 2009;373(9659):240-9.
32. Ball D. Working paper 3: Regulation of mark-ups in the pharmaceutical supply chain—review series on pharmaceutical pricing policies and interventions. Geneva: World Health Organization and Health Action International; 2011.
33. Levison L, Laing R. The hidden costs of essential medicines. Essential Drugs Monitor. 2003;33:20-1.
34. Vogler S. The impact of pharmaceutical pricing and reimbursement policies on generics uptake: implementation of policy options on generics in 29 European countries–an overview. Generics and Biosimilars Initiative (GaBI Journal). 2012;1(2):93-100. doi:10.5639/gabij.2012.0102.020
35. Godman B, Bennie M, Baumgärtel C, Sovic-Brkicic L, Burkhardt T, Fürst J, et al. Essential to increase the use of generics in Europe to maintain comprehensive health care? Farmeconomia Health economics and therapeutic pathways. 2012;13(3S):
5-20.
36. Habl C, Vogler S, Leopold C, Schmickl B, FrÖschl B. Referenzpreissysteme in Europa. Analyse und Umsetzungsvoraussetzungen für Österreich. Vienna: ÖBIG Forschungs- und Planungsgesellschaft mbH; 2008.
37. Vogler S, Habl C, Leopold C, Mazag J, Morak S, Zimmermann N. PHIS Hospital Pharma Report. Vienna: Pharmaceutical Health Information System (PHIS); 2010.
38. Vogler S, Zimmermann N, Mazag J. Procuring medicines in hospitals: results of the European PHIS survey. Eur J Hosp Pharm Prac. 2011(2):20-1.
39. Vogler S, Zimmermann N, Leopold C, Habl C, Mazag J. Discounts and rebates granted for medicines for hospital use in five European countries. The Open Pharmacoeconomics & Health Economics Journal. 2013;5:1-25.
40. Lopes S, Marty C, Berdai D. PHIS Pharma Profile France. Vienna: Pharmaceutical Health Information System (PHIS); 2011.
41. Vogler S, Zimmermann N, Habl C, Piessnegger J, Bucsics A. Discounts and rebates granted to public payers for medicines in European countries. South Med Rev. 2012;5(1):38-46.
42. Espín J, Rovira J, García L. Experiences and impact of European risk-sharing schemes focusing on oncology medicines. EMINet; 2011.
43. Adamski J, Godman B, Ofierska-Sujkowska G, Osinska B, Herholz H, Wendykowska K, et al. Risk sharing arrangements for pharmaceuticals: potential considerations and recommendations for European payers. BMC Health Serv Res. 2010;10:153.
44. European Pharmaceutical Marketing Research Association (EphMRA). EphMRA Lexicon. A pocket guide to pharmaceutical marketing and marketing research terms and definitions. Stalybridge, no year available.
45. World Health Organization. WHO International Working Group for Drug Statistics Methodology, WHO Collaborating Centre for Drug Statistics Methodology, WHO Collaborating Centre for Drug Utilization Research and Clinical Pharmacological Services. Introduction to drug utilization research. Oslo: World Health Organization; 2003.
46. World Health Organization. The rational use of drugs—Report of the conference of experts; 25-29 November 1985; Nairobi. 1987 [cited 2013 Jun 7]. Available from: http://apps.who.int/medicinedocs/documents/s17054e/s17054e.pdf
47. Lee D, Bergman U, Strom B. Studies of drug utilization. Pharmacoepidemiology. 1994;2:379-93.
48. Godman B, Shrank W, Andersen M, Berg C, Bishop I, Burkhardt T, et al. Policies to enhance prescribing efficiency in Europe: findings and future implications. Front pharmacol. 2010;1:141.
49. Dylst P, Vulto A, Simoens S. Demand-side policies to encourage the use of generic medicines: an overview. Expert Rev Pharmacoecon Outcomes Res. 2013;13(1):59-72.
50. Vogler S, Schmickl B. Rationale Arzneimitteltherapie in Europa. Vienna: Gesundheit Österreich GmbH; 2010.
51. Godman B, Wettermark B, Hoffmann M, Andersson K, Haycox A, Gustafsson LL. Multifaceted national and regional drug reforms and initiatives in ambulatory care in Sweden: global relevance. Expert Rev Pharmacoecon Outcomes Res. 2009;9(1):65-83.
52. Wettermark B, Pehrsson A, Juhasz-Haverinen M, Veg A, Edlert M, Tornwall-Bergendahl G, et al. Financial incentives linked to self-assessment of prescribing patterns: a new approach for quality improvement of drug prescribing in primary care. Qual Prim Care. 2009;17(3):179-89.
53. Elliot D, Byrne G. PPRI Pharma Profile Ireland. Vienna: Pharmaceutical Pricing and Reimbursement Information (PPRI); 2007.
54. Rosian I, Habl C, Vogler S. Pharmaceuticals market control in nine European countries. Vienna: Österreichisches Bundesinstitut für Gesundheitswesen (ÖBIG); 1998.
55. Leopold C, Habl C, Vogler S, Rosian-Schikuta I. Steuerung des Arzneimittelverbrauchs am Beispiel Dänemark. Vienna: Gesundheit Österreich GmbH (Austrian Health Institute); 2008.
56. Godman B, Paterson K, MalmstrÖm RE, Selke G, Fagot JP, Mrak J. Improving the managed entry of new medicines: sharing experiences across Europe. Expert Rev Pharmacoecon Outcomes Res. 2012;12(4):439-41.
57. DeSwaef A, Antonissen Y. PPRI Pharma Profile Belgium. Vienna: Pharmaceutical Pricing and Reimbursement Information (PPRI); 2008.
58. Fraeyman J, Van Hal G, Godman B, Beutels P. The potential influence of various initiatives to improve rational prescribing for proton pump inhibitors and statins in Belgium. Expert Rev Pharmacoecon Outcomes Res. 2013;13(1):141-51.
59. PPRI network members. PPRI /PHIS Pharma Profiles—country specific reports on pharmaceutical systems and policies. Vienna [cited 2013 Jun 7]. Available from: http://whocc.goeg.at/Publications/CountryReports, 2007-2012.
60. Vogler S, Zimmermann N, Leopold C, de Joncheere K. Pharmaceutical policies in European countries in response to the global financial crisis. South Med Rev. 2011;4(2):69-79.
61. Garuoliene K, Godman B, Gulbinovic J, Wettermark B, Haycox A. European countries with small populations can obtain low prices for drugs: Lithuania as a case history. Expert Rev Pharmacoecon Outcomes Res. 2011;11(3):343-9.
62. Bennie M, Godman B, Bishop I, Campbell S. Multiple initiatives continue to enhance the prescribing efficiency for the proton pump inhibitors and statins in Scotland. Expert Rev Pharmacoecon Outcomes Res. 2012;12(1):125-30.
63. Kullman D. PHIS Pharma Profile United Kingdom. Vienna: Pharmaceutical Health Information System (PHIS); 2011.
64. Czypionka T, Riedel M, RÖhrling G, Mayer S, Rasinger T. Mengenkontrolle im Arzneimittelbereich: internationale Evidenz für Österreich. Health System Watch. 2010(3):1-16. German.
65. Hill P. International price levels and purchasing power parities. OECD Economic Studies. 1986;6:133-59.
66. Zimmermann N, Vogler S. PHIS Hospital Pharma Report Austria. Vienna: Pharmaceutical Health Information System (PHIS); 2009.
67. OECD. Health Data. Paris: OECD; June 2011.
68. Zalesakova P. PHIS Hospital Pharma Report Czech Republic. Vienna: Pharmaceutical Health Information System (PHIS); 2009.
69. PHIS network members. Country-specific information provided to PHIS Hospital Pharma survey (unpublished).
70. Martinez V, Ferré de la Peña P, Izquierdo G, Lens Cabrera C. PHIS Pharma Profile Spain. Vienna: Pharmaceutical Health Information System (PHIS); 2010.
71. Närhi U. PHIS Hospital Pharma Report Finland. Vienna: Pharmaceutical Health Information System (PHIS); 2009.
72. AIFA. PHIS Hospital Pharma Report Italy draft. Pharmaceutical Health Information System (PHIS); 2010 (unpublished).
73. Gulbe A, Innus J, Martinsons A. PHIS Hospital Pharma Report Latvia. Vienna: Pharmaceutical Health Information System (PHIS); 2009.
74. Eurostat. Eurostat Health Database. February 2011.
75. Storms H, Schreurs M. PHIS Pharma Profile The Netherlands (draft, unpublished). Pharmaceutical Health Information System (PHIS); 2011.
76. Adamski J, Wndykowska K. PHIS Hospital Pharma Report Poland. Vienna: Pharmaceutical Health Information System (PHIS); 2009.
77. Caldeira S, Furtado C, Vieira I, Baptista A. PHIS Hospital Pharma Report Portugal. Vienna: Pharmaceutical Health Information System (PHIS); 2010.
78. Aanes T, Ognøy AH, Festøy H. PHIS Hospital Pharma Report Norway. Vienna: Pharmaceutical Health Information System (PHIS); 2009.
79. Zahra Pullis I. PHIS Hospital Pharma Report Malta. Vienna: Pharmaceutical Health Information System (PHIS); 2009.
|
Author for correspondence: Sabine Vogler, PhD, Head of WHO Collaborating Centre for Pharmaceutical Pricing and Reimbursement Policies, Health Economics Department, Gesundheit Österreich GmbH (Austrian Health Institute)/Geschäftsbereich ÖBIG, 6 Stubenring, AT-1010 Vienna, Austria |
Disclosure of Conflict of Interest Statement is available upon request.
Copyright © 2013 Pro Pharma Communications International
Permission granted to reproduce for personal and non-commercial use only. All other reproduction, copy or reprinting of all or part of any ‘Content’ found on this website is strictly prohibited without the prior consent of the publisher. Contact the publisher to obtain permission before redistributing.
Source URL: https://gabi-journal.net/understanding-the-components-of-pharmaceutical-expenditure-overview-of-pharmaceutical-policies-influencing-expenditure-across-european-countries.html
Copyright ©2025 GaBI Journal unless otherwise noted.