Author byline as per print journal: Shih-Ting Chiu, PhD, Chen Chen, MSc, Professor Shein-Chung Chow, PhD, Eric Chi, PhD
|
Introduction: For generic approval of small-molecule (chemical) drug products, US Food and Drug Administration requires evidence of equivalence in average bioavailability from bioavailability and bioequivalence studies. To address drug interchangeability, population bioequivalence (PBE) for drug prescribability and individual bioequivalence (IBE) for drug switchability under replicated crossover designs have been proposed. |
Submitted: 18 March 2013; Revised: 19 May 2013; Accepted: 3 June 2013; Published online first: 17 June 2013
Biological products are therapeutic moiety manufactured by a living system or organism, such as human, plant, animal, or micro-organism. Many best-selling biological products will expire in years to come. Therefore, innovative biological products can be generically reproduced and marketed.
When an innovative (brand-name) small-molecule (chemical) drug product is going off patent, pharmaceutical or generic drug companies can file an abbreviated new drug application for generic approval. For approval of generic drug products, US Food and Drug Administration (FDA) requires that evidence of equivalence in average bioavailability (in terms of drug absorption) is provided from bioavailability or bioequivalence studies [1].
The assessment of bioequivalence in average bioavailability is usually referred to as the assessment of average bioequivalence (ABE), which focuses on average bioavailability but ignores variability, e.g. intra-subject variability, inter-subject variability, and variability caused by subject-by-drug interaction, associated with the observed responses. As a result, generic drug products are becoming increasingly available. It is a concern that an ABE for generic approval can equate to quality, safety, and efficacy. To address drug interchangeability, the concept of population bioequivalence for drug prescribability and individual bioequivalence (IBE) for drug switchability under replicated crossover design have also been proposed [2].
Unlike small-molecule drug products, the generic versions of biological products are similar biological drug products. These are not generic drug products, which are usually referred to as drug products with identical active ingredient(s) as the innovative drug product, but are similar to the innovative biological products. They are made in living cells or organisms, which is different from (small molecule) generic drug products. Generic drug products are fundamentally different from those of biosimilar (large molecule) drug products [3]. For example, biosimilar products have a heterogeneous structure (usually mixtures of related molecules), which is difficult to characterize. In addition, biosimilar products are often variable and sensitive to environmental conditions, such as light and temperature. A small change or variation at any critical stage of the manufacturing process of a biological product could result in a drastic change in clinical outcomes.
Because of these fundamental differences, current standard methods for bioequivalence assessment of generic drug products may not be appropriate for assessing biosimilar products [4, 5].
In this manuscript, we focus on the assessment of biosimilarity by using IBE rather than the assessment ABE, because biosimilar products are known to be variable and sensitive to small changes (variations) in environmental factors during the manufacturing process. For assessment of IBE, the method proposed by Hyslop et al. [6] is recommended under a replicated crossover design, e.g. TRTR, RTRT or TRT, RTR, where t is the test product and r is the reference product. Chow et al. [7] proposed a 2 × 3 extra-reference design, i.e. TRR, RTR, which was shown to be the most efficient design among 2 × 3 replicated crossover design for assessing IBE. Thus, in this manuscript, we focus on assessing biosimilarity of biosimilar products by constructing a 95% upper confidence bound for the IBE criterion recommended by FDA using the generalized pivotal quantities (GPQs) method under the 2 × 3 extra-reference crossover design. We conduct a simulation study to evaluate the performance of the proposed method under various scenarios.
Study design
For assessment of IBE, Chow et al. [7] indicated that the following 2 × 3 extra-reference design given in Table 1 is the most efficient design among the 2 × 3 crossover designs. In some cases, the 2 × 3 extra-reference design is also more efficient than the 2 × 4 replicated crossover design. We, therefore, focus on the 2 × 3 extra-reference design.
Under the 2 × 3 extra-reference design, qualified subjects will be randomly assigned to either sequence 1 or sequence 2 with equal probability. For example, subjects who are assigned to sequence 1 will receive test treatment first, then are crossed-over to receive the reference product after a sufficient length of washout, then get crossed-over to receive the reference product after another sufficient length of washout.
Statistical model
Let yijk be the response from subject i in sequence k at period j of the experiment. The statistical model for the 2 × 3 extra-reference design can be described as follows:
l = T, R (treatment: T (test product), R (reference product)); k = 1, 2 (sequence); i = 1,…,nk (subject); j = 1, 2, 3 (period)

μlis the mean of the l treatment
Fl is the fixed effect of formulation l
Wljk’s are nuisance parameters and can include fixed period, sequence, and interaction effects.
Slik is the random effect of subject i in sequence k under formulation l and (STik, SRik). They are independent and identically distributed bivariate normal random vectors with mean  and an unknown covariance matrix
 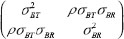 .
.
where  are between-subject variances and ρ is the covariance of two formulations under model (1). εlijkis the random error for subject i within sequence k on period j of treatment l and assumed to be mutually independent and identically distributed as
  where
where  are within-subject variances under model (1).
Individual bioequivalence criterion, hypothesis, and modified large sample method
According to the 2001 FDA guidance [8], let FT be the average pharmacokinetics (PK) response from the test formulation, and FR and FR′ be two identically distributed average responses from an individual under the reference formulation.
Then the drug switchability can be measured by
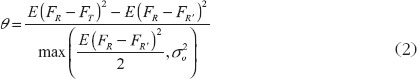
Under the 2 × 3 extra-reference design, θ is equal to

where  and
and  , which is the difference of effect between the two formulations.
Note that  are within-subject variances for test and reference formulation separately.
  is the variance of subject-by-interaction and
  is the minimum within-subject variance of reference formulation specified by FDA.
When  , θ is referred to as the constant-scale and
  , θ is referred to as the reference-scale by FDA. IBE can be claimed if the following null hypothesis H0 is rejected at the 5% level of significance:

where θ0 = 2.4938 is an upper limit specified in the 2001 FDA guidance [8]. On the basis of the hypothesis in (4), the IBE criterion can be expressed as the following linearized criteria:

As the result, the testing hypothesis based on the linearized criteria (5) will be given as:

Under the same accuracy of estimation on  , the 2 × 3 extra-reference design needs fewer observations than 2 × 4 crossover design, and even provides more efficiency as the same number of observations. To avoid the estimation of
  , the following decomposition of γ in criteria (5) can been shown equal to

where 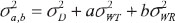
Let  be the mean of average observations xlik under the formulation l in sequence k and
  be the mean of zlik, which is the difference between the two observations under the l formulation in sequence k.
Then unbiased estimators of

And an unbiased estimator of δ is 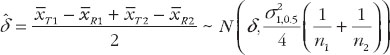
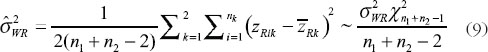
have been given by Chow et al. [7]. They proposed the confidence bound based on the hypothesis (6). For the reference-scale:

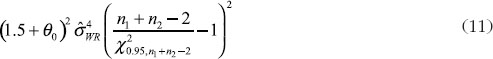
where U is the sum of the following three quantities

and
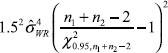
For the constant-scale, the confidence bound will be

where U0 is the same as U expect that the quantity in Equation (11) should be replaced by
One of the major disadvantages of the method described above is that the estimate may depend on unknown nuisance parameters that may affect the size and power of the IBE hypothesis testing. To overcome this drawback, alternatively, we may consider the GPQ method, which can avoid the inference of nuisance parameters [9]. Assume that Y is a random variable whose distribution depends on a vector of unknown parameters ζ = (θ, η), wherev θ is a parameter of interest and η is a vector of nuisance parameters. Let Y be a random sample from Y and y be the observed value of Y. Furthermore, let R = R(Y; y, ζ) be a function of Y, y, and ζ. The random quantity R is said to be a GPQ, satisfying the following two conditions:
a) The distribution of R does not depend on any unknown parameters.
b) The observed value of R, say r = R(y; y, ζ) is free of the vector of nuisance parameters η.
In other words, r is only a function of (y, θ). The distribution of GPQ of a vector that contains parameters of interest and nuisance parameters does not depend on any unknown parameters, and the observed value of GPQ is free of the vector of the nuisance parameters. On the basis of the GPQ concept, we can find the GPQ for γ in Equation (7).

For the GPQ of  , let
, let  .
.
We can find the GPQ for  is given as

which does not depend on any unknown parameters.
Also, let  , then we can find the GPQ for
  is given as

Since,  ,
,  may not be a good estimator for
  , and let
 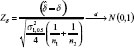 as
as  and
and 

then the GPQ for δ2 can be given as  .
.
Therefore, we can get  by substituting
  with equation (14),
 and with equation (15) with equation (16) into the following equations:


are GPQ for γ’ in reference scale and constant scale in reference scale and constant scale.
Generalized upper confidence limit A 100(1–α)% generalized upper confidence limit for γ’ is given by R1–α, where R1–α is the 100(1–α)th percentiles of the distribution of . The percentiles of can be analytically estimated using Monte Carlo algorithm.
Step 1: Choose a large simulation size, say B = 10,000. For b equal to 1 through B, carry out the following steps.
Step 2: Independent generate univariate standard normal random variable  ,
,  and central chi-square variables
  and
and  with degrees of freedom
  , respectively.
Step 3: For the realized values of  and
and  , compute as defined in Equation (17) and (18).
The required upper 100(1–α)th percentiles of the distribution of GPQ for γ’, which is also the upper 100(1–α)th generalized confidence limit for γ’, is then estimated by the 100(1–α)th sample R,percentiles of the collection of B = 10,000 realizations  .
.
The upper 100(1–α)% generalized confidence limit for γ based on GPQ can be used to test the statistical hypothesis for the IBE test. The null hypothesis is rejected and the individual bioequivalence is concluded at the α significance level if the upper 100(1–α)% generalized confidence limit for γ is less than 0.
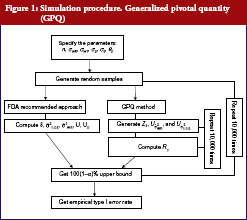
The following simulation study aims to compare the empirical size between two upper confidences bound on testing the IBE we have already described. The first approach was proposed by Chow et al. [7], which is based on the method recommended by Hyslop et al. [6] in FDA guidance. The second one is our proposed GPQ approach. To compare the two methods, we conducted a simulation study. The whole simulation procedure is presented in Figure 1. On the basis of Equation (7), we specify the different parameter combinations. For sample size per arm, we consider the sample size allocation as n = n1 = n2 = 10, 15, 20, 25, 30, 35 and 40. Let the variance of subject-by-interaction as σD = 0, within-subject variances for test as σWT = 0.15, 0.2, 0.3, 0.5, within-subject variances for reference as σWR = 0.15, 0.2, 0.3, 0.5. And upper limit as θ0 = 2.4948, the minimum within-subject variance σ0 = 0.2, which are referred to the regulation by FDA guidance.
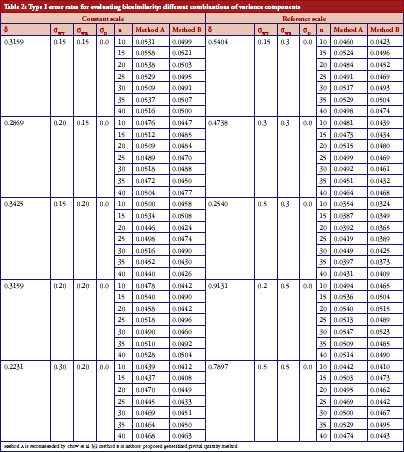
We aimed to study the empirical size between two upper confidences bound when the linearized criteria γ′ are set equal to 0. The result for both constant and reference scales are presented in Table 2. The power curves are shown in Figure 2. At the 5% significance level, 10,000 random samples each parameter combination will be conducted to compute type I error probability and power for IBE test based on the two methods. In additional, for obtaining GPQ confidence bound, , will be generated in each distribution independently by the rnorm() function in R programme. Whole simulation is calculated and random samples are generated by using R version 2.15.2 [10].
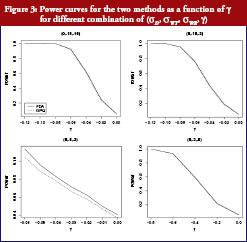
On the basis of the results presented in Table 2, overall type I error rate of the GPQ approach is more stable than the method recommended by FDA. The empirical size of our proposed method can always keep within the significant level we pre-specified, i.e. 0.05. In Figure 2, we have only slight difference on the power curves between two methods. The empirical power comparison was almost the same in the two methods. Both methods have 80% power when the sample size was over 35 per arm in most of our cases. The power decreases to lower than 20%, however, when σWT increases to 0.5, even when we have 40 samples per arm. How the power decreases with γ is shown in Figure 3. As two curves are also close to each other in Figure 3, it means the sample sizes required for the same power by two methods are almost the same.
In the 2001 guidance [8], FDA recommended 2 × 3 or 2 × 4 replicated crossover design to assess IBE. In this manuscript, we consider 2 × 3 extra-reference design with the GPQ approach, which requires the same number of observations as the 2 × 3 crossover design and the same reference sample size as the 2 × 4 crossover design. FDA’s method can estimate more components, but our method with the GPQ approach is more efficient than 2 × 3 or 2 × 4 crossover design [7]. The GPQ approach, however, needs a longer calculation process than the method proposed by FDA. The distribution of proposed GPQ could approach the true distribution of γ very well by the bootstrap distribution procedure. As biological products are sensitive to manufacturing process changes, the variance could be larger than the common small-molecule drugs. In additional, the criterion γ is composed of serious parameters that may destabilize the estimation. On the basis of our results in the simulation section, the GPQ-based approach has smaller type I error rates than the method proposed by Chow et al. [7]. Both methods have almost the same power with equal sample size. By using the GPQ approach, the influence of the nuisance factor could be reduced. GPQ method can focus on the interesting parameter because GPQ is free of nuisance parameters. Therefore, GPQ is an appropriate method for assessing biosimilarity of biosimilar products that have higher variability than small-molecule drugs.
To assess interchangeability, FDA recommends 2 × 3 crossover design, e.g. TRT, RTR or TRR, RTT, or a 2 × 4 crossover design, e.g. TRTR, RTRT in the 2001 guidance. The TRR, RTT 2 × 3 crossover design can estimate the carryover effect by repeating formulation in the last period of each sequence. The 2 × 3 extra-reference design (TRR, RTR) repeats only in the first sequence to estimate the carryover effect of the reference sample. Addition of the third sequence (RRT) to 2 × 3 extra-reference design to include all possible ‘two references and one test’ cases, and 3 × 3 complete design. Note that the decomposition of γ of 2 × 3 extra-reference design and 3 × 3 complete design are the same. Therefore, we can propose similar GPQ of 3 × 3 complete design. The 3 × 3 complete design can provide a more accurate estimate if we have enough reference samples, but 2 ×3 extra-reference can also estimate the with less sample size than 3 × 3 complete design. And for both 2 × 3 extra-reference design and 3 × 3 complete design, can be avoided by the decomplosition of γ in the Equation (7).
With the design described above, GPQ can be easily applied to assessing interchangeability of biosimilar products, i.e. alternating and switching by knowing the improved decomposition of and its unbiased estimator.
Competing interests: Dr Shih-Ting Chiu, Chen Chen and Professor Shein-Chung Chow are the primary authors of the article. Dr Eric Chi provided some comments for this study. This manuscript was not funded by Amgen Inc.
Dr Eric Chi is Director of Biostatistics in the Biosimilar Division at Amgen Inc.
This manuscript represents the views of the author and is not necessarily representative of Amgen’s.
Provenance and peer review: Not commissioned; externally peer reviewed.
Shih-Ting Chiu, PhD
Chen Chen, MSc
Professor Shein-Chung Chow, PhD
Duke University School of Medicine, Durham, North Carolina, USA
Eric Chi, PhD
Amgen, Inc, Thousand Oaks, California, USA
References
1. US Food and Drug Administration. Guidance for Industry. Bioavailability and bioequivalence studies for orally administered drug. Products–general considerations [homepage on the Internet]. 2003 [cited 2013 May 19]. Available from: http://www.fda.gov/downloads/Drugs/…/Guidances/ucm070124.pdf
2. Chow SC, Liu JP. Design and analysis of bioavailability and bioequivalence studies.3rd ed. New York:Marcel Dekker;2008.
3. Chow SC, Ju C. Assessing biosimilarity and interchangeability of biosimilar products under the Biologics Price Competition and Innovation Act. Generics and Biosimilars Initiative Journal (GaBI Journal). 2013;2(1):20-5. doi:10.5639/gabij.2013.0201.004
4. Chow SC. Quantitative evaluation of bioequivalence/biosimilarity. J Bioequiv Availab, S1. 002. 2011.
5. Chow SC. Biosimilars: design and analysis of follow-on biologics. New York: Chapman and Hall/CRC Press, Taylor and Francis; 2013.
6. Hyslop T, Hsuan F, Holder DJ. A small sample confidence interval approach to assess individual bioequivalence. Stat Med. 2000;19(20):
2885-97.
7. Chow SC, Shao J, Wang H. Individual bioequivalence testing under 2 × 3 design. Stat Med. 2002;21(5):629-48.
8. US Food and Drug Administration. Guidance for Industry. Statistical approaches to establishing bioequivalence [homepage on the Internet]. 2001 [cited 2013 May 19]. Available from: http://www.fda.gov/downloads/
Drugs/Guidances/ucm070244.pdf
9. Chiu ST, Tsai PY, Liu JP. Statistical evaluation of non-profile analyses for the in vitro bioequivalence. J Chemometr. 2010;24(10):617-25.
10. R Development Core Team. R: A language and environment for statistical computing. R Foundation for Statistical Computing, Vienna, Austria: 2008 [cited 2013 May 19]. ISBN 3-900051-07-0. Available from: http://www.R-project.org
|
Author for correspondence: Shih-Ting Chiu, PhD, Postdoctoral Associate, Department of Biostatistics and Bioinformatics, Duke University School of Medicine, Duke Box 2721, Suite 1102, 2424 Erwin Road, 11069 Hock Plaza, Durham, NC 27705, USA |
Disclosure of Conflict of Interest Statement is available upon request.
Copyright © 2013 Pro Pharma Communications International
Permission granted to reproduce for personal and non-commercial use only. All other reproduction, copy or reprinting of all or part of any ‘Content’ found on this website is strictly prohibited without the prior consent of the publisher. Contact the publisher to obtain permission before redistributing.
Source URL: https://gabi-journal.net/assessing-biosimilarity-using-the-method-of-generalized-pivotal-quantities.html
Copyright ©2025 GaBI Journal unless otherwise noted.