Establishment of reference standards in biosimilar studies
Published on 2013/06/11
Generics and Biosimilars Initiative Journal (GaBI Journal). 2013;2(4):173-7.
Author byline as per print journal: Aijing Zhang, PhD, Associate Professor Jung-Ying Tzeng, Professor Shein-Chung Chow, PhD
|
Abstract: |
Submitted: 24 April 2013; Revised: 10 June 2013; Accepted: 8 July 2013; Published online first: 31 July 2013
Introduction
A biosimilar product is defined as a biological drug product that is highly similar to the reference product notwithstanding minor differences in clinically inactive components. No clinically meaningful differences exist in terms of safety, purity, and potency (Biologics Price Competition and Innovation [BPCI] Act 2009). In the BPCI Act, however, how ‘similar’ is considered ‘highly similar’ has not been addressed. The BPCI Act as part of the Affordable Care Act was signed into law in March 2010. It gave FDA the authority to approve similar biological drug products. Currently, FDA has not set out clear standards for biosimilar approvals [1].
Kang and Chow [2] proposed a method that uses the relative difference, i.e. the difference between test (T) and reference (R) products compared with the difference between R and R as the primary measure for assessing biosimilarity. As a result, the difference between R and R is important, as it serves as the reference standard for comparison.
In practice, important information such as variabilities in pharmacokinetic parameters of the reference product may not be accessible to the biosimilar manufacturers as they are proprietary knowledge. Thus, it is important to conduct a reference-replicated study (R-R study), i.e. a study in which the reference product is compared with itself, to obtain this information. As biosimilar products are made by living cells or organisms that are sensitive to small changes or variations in environmental factors, such as light or temperature, it is expected that a small difference will occur between two reference products resulting from different manufacturing processes or locations, or different batches from the same manufacturing process. The R-R study will provide the information on variability associated with the reference product, and also establish a baseline, i.e. similarity between R and R, for comparison in biosimilarity testing.
The biosimilarity index approach was proposed by Chow et al. [3, 4] to assess the level of similarity. The index is based on the concept of reproducibility probability and is evaluated as the estimated power of the testing procedure when the alternative hypothesis is true. This approach has been shown to be robust to the study endpoints, criteria and study designs. Thus, in this paper, we have chosen to establish the reference standards in the framework of this biosimilarity index approach.
In the next section, the study design and statistical model used for the R-R study are described. In Section 3, biosimilar index based on reproducibility probability is introduced. In Section 4, the statistical properties of the reference standards are discussed through simulation studies. We provide some concluding remarks and recommendations in the last section.
Study design and statistical model
Study design
Crossover designs are often recommended for bioequivalence studies. Biosimilarity is often assessed in a parallel design in practice [5], however, because of the relatively long half-life and the possibility of immunogenicity of biological products, concerns are increasing over interchangeability in biosimilars, which can only be assessed in crossover designs. Thus, we have chosen a standard two-sequence, two-period (2 × 2) crossover design for the establishment of reference standards. A 2 × 2 crossover study can be viewed as a two-arm parallel study with replicates; the advantage of using a crossover design is that the intra-subject variability could be estimated for the reference standards.
In a 2 × 2 standard crossover study design, participants are randomly assigned to either sequence 1 (R1R2) or sequence 2 (R2R1) in the R-R study. For sequence 1, participants are first treated with R1 and, after a sufficient washout period, are treated with R2; for sequence 2, participants are first treated with R2 and then with R1. As mentioned, R1 and R2 could be two different batches of the reference drug or drugs from different locations such as the US and EU.
Statistical model
The interval hypotheses of the similarity testing written in terms of parameters are:
![]()
where ? is the study parameter chosen to assess biosimilarity; ?L and ?U are the biosimilarity limits, i.e. the accepted lower and upper bounds for declaring biosimilarity. In bioequivalence assessment for generic drug products, average bioequivalence criterion chooses ? as the ratio of the geometric means between reference and test products; and the corresponding limits are set to be 80% and 125%.
The hypotheses in equation (1) are usually decomposed into two sets of one-sided hypotheses:
![]()
Schuirmann’s two one-sided tests procedure is commonly used for testing the hypotheses in equation (2) [6]. The overall p value is the larger of the p values from these two tests.
For a standard 2 x 2 crossover study design, we consider the following statistical model with the assumption of no carryover effects:
![]()
where Yijk is the response for subject i in the kth sequence at the jth period, where i = 1, … , nk indicates subject, j = 1, 2 indicates period, k = 1, 2 indicates sequence; µ represents the overall mean; Sik represents the random effect of ith subject in kth sequence, assumed independently and identically distributed (i.i.d.) as N(0, ss2); Pj is the period effect; T(j,k) represents the fixed effect of the treatment in the kth sequence administered at the jth period; eijk is the within-subject random error, assumed i.i.d. as N(0, se2). Finally Sik’s and eijk’s are assumed to be mutually independent.
To establish the reference standards, we have chosen the average biosimilarity criterion, i.e. ? = µR2 – µR1. One concludes average biosimilarity if
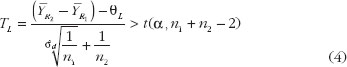
and
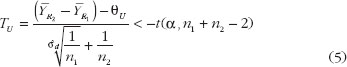
where ![]() and
and ![]() are the least square means for the two reference products; they can be obtained from the sequence-by-period means:
are the least square means for the two reference products; they can be obtained from the sequence-by-period means: ![]() and
and ![]() ; n1 and n2 are the number of subjects in sequence 1 and sequence 2;
; n1 and n2 are the number of subjects in sequence 1 and sequence 2; ![]() is the pooled sample variance of period difference from both sequences, and can be obtained from
is the pooled sample variance of period difference from both sequences, and can be obtained from ![]() , where
, where ![]() .
.
Biosimilarity index
Definition
To reflect the characteristics and effect of variability on the therapeutic effect of biological products, Chow et al. [3, 4] in 2011 proposed the development of an index based on the concept of the reproducibility probability to assess ‘highly biosimilar’.
Reproducibility probability in clinical trials was first proposed in 2002 by Shao and Chow [7] to provide assessment on the strength of evidence against null hypothesis for regulatory agencies in deciding whether a single clinical trial is sufficient for approval. Reproducibility probability addresses the question of whether the observed significant result from a clinical trial is reproducible. Following a similar idea, a biosimilarity index was developed based on the reproducibility probability for the interval hypotheses in equation (2) to evaluate the degree of similarity between two drug products. That is, we define a reproducibility probability for evaluating the biosimilarity of two drug products as follows:
PBI = concluding average biosimilarity between two products in a future trial given that the average biosimilarity based on a chosen criterion has been established in the first trial.
Evaluation
To evaluate the biosimilarity index, the index is expressed as the estimated power of the testing procedure when the alternative hypothesis is true, replacing the parameter by its estimate based on the data observed. By this estimated power approach, the biosimilarity index ![]() for the 2 × 2 crossover design and average biosimilarity criterion can be obtained from the following equation:
for the 2 × 2 crossover design and average biosimilarity criterion can be obtained from the following equation:
![]()
where TL and TU are the test statistics given in equation (4) and equation (5). Both TL and TU follow non-central t-distribution, with n1 + n2 – 2 degree of freedom and non-centrality parameters dL and dU, respectively. dL and dU relate to the population means, variances and similarity limits; their estimate ![]() and
and ![]() can be obtained from the data using the formulas
can be obtained from the data using the formulas  and
and 
Steps
To apply the proposed biosimilarity index approach to assess biosimilarity, Chow et al. in 2013 proposed the following steps [8], see Table 1.
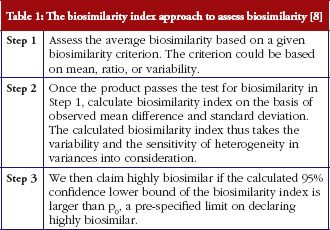
To establish p0, we recommend it be based on pRR, the biosimilarity index obtained in an R-R study. By basing p0 on pRR, the biosimilarity index approach allows us to assess the degree of similarity relative to the reference product.
Merits
From the definition of the biosimilarity index and the testing steps illustrated above, we can see that this approach has the following advantages. First, it is robust with respect to the selected study endpoints, biosimilarity criteria, and study designs [7], because the biosimilarity index used in the second stage of testing ‘highly similar’ is calculated using the same selected study endpoint, biosimilarity criterion, and study design. Second, it takes variability into consideration in the calculation of the index, and is sensitive to the variance of the test products. Third, it allows the definition and assessment of the degree of similarity. Or, in other words, it provides an answer to the question of ‘how similar is considered highly similar?’
Establishing reference standard
In practice, important information about the innovative (reference) product may not be available for assessment. Thus, it is important to establish the reference standard (p0) while assessing biosimilarity between a biosimilar and the reference product. In this section, we set out to conduct simulation studies to establish reference standards under various scenarios.
Simulation design
Simulation studies were conducted to demonstrate how to establish reference standards. Standard 2 × 2 crossover design and average biosimilarity criterion are used. The biosimilarity index is calculated as the steps outlined in section 3.
The study parameter ? is the mean difference, i.e. ? = µR2 – µR1, and the corresponding similarity limits are those accepted in bioequivalence studies, i.e. (?L, ?U) = (log0.8, log1.25) = (-0.223, 0.223). The data are assumed to following normal distribution, and the means and variances of the two reference products are assumed to be the same in the simulation, i.e. µR1 = µR2 = µ and sR1 = sR2 = s. To evaluate how reference standards are affected by variability of the drug products, different coefficients of variation are chosen: 20–50% by an increment of 5%. Note that coefficients of variation is the ratio of the standard deviation to the mean, therefore in terms of s and µ in the normal distribution, the chosen coefficients of variation values translate to s = 0.2µ, 0.25µ, 0.3µ, 0.35µ, 0.4µ, 0.45µ or 0.5µ. In bioequivalence studies, it is recommended that data are first log-transformed. For lognormal distribution, coefficients of variation of 20%, 25%, 30%, 35%, 40%, 45% and 50% translate to s = 0.2, 0.25, 0.294, 0.340, 0.385, 0.429 and 0.472 (![]() ). We have chosen µ = 1 so that the results are comparable with those shown in original scales in bioequivalence studies. The effects of different sample sizes (n = n1 + n2 = 40, 50, 60, 70, 80, 90 and 100) with equal allocation are also investigated. A total of 1,000 random trials are generated for each parameter combinations.
). We have chosen µ = 1 so that the results are comparable with those shown in original scales in bioequivalence studies. The effects of different sample sizes (n = n1 + n2 = 40, 50, 60, 70, 80, 90 and 100) with equal allocation are also investigated. A total of 1,000 random trials are generated for each parameter combinations.
Results
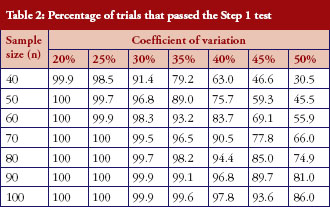
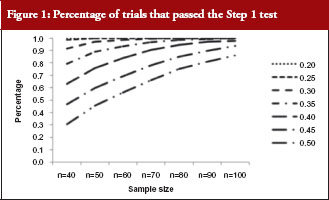
The percentage of trials that have passed the Step 1 biosimilarity test, i.e. the probability of claiming biosimilarity on the basis of the average biosimilarity criterion, are shown in Table 2 and Figure 1. The results are in accordance with results observed in other studies [9]. As the variability increases, the probability decreases. Even with no mean difference between the two drug products, the probability of concluding biosimilarity can be quite low when the coefficients of variation are high. For example, when the coefficients of variation is 50%, with a total sample size of 40, biosimilarity is concluded only about 30% of the times. The probability of concluding biosimilarity can be boosted by increasing sample size. In the previous scenario, the probability can be increased from 30% to 86% if a sample size of 100 is used instead of 40.
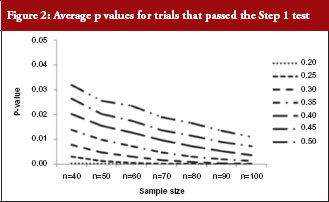
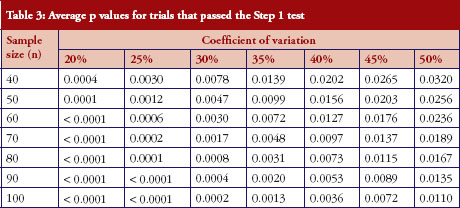
For those trials that have passed the Step 1 test, the p values from the Schuirmann’s two one-sided tests procedure are recorded and the averages are reported in Table 3 and Figure 2. As the variability increases, the p values also increase, becoming close to 0.05. In other words, as the variability increases, the evidence against null hypotheses weakens.
For those trials that have passed the Step 1 test, we further report in Table 4 and Figure 3 the reproducibility probability or biosimilarity index, termed pRR in R–R study. The pRR is calculated from equation (6). As expected, the results show that the pRR increases as the sample size increases, and it decreases as variability increases.
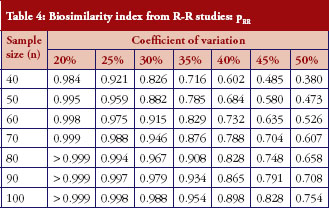
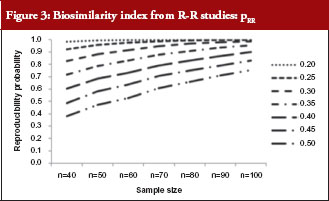
Notice that when the coefficients of variation are 45%, and the total sample size is 40, the pRR is only 48.5%. When a reference drug compared with itself can only have a 48.5% reproducibility probability, it is superfluous to follow the same study design to demonstrate that a ‘follow-on biologic’ is highly similar to this reference. There are two ways to correct a low pRR: one is to choose a different criterion as in bioequivalence studies with the use of a scaled criterion; the other is to increase sample size. This also demonstrates the importance of conducting an R–R study: one is able to choose an appropriate criterion, sample size, or both, to establish reference standards.
An example
As shown above in the simulation studies, as coefficients of variation increase, it is less likely that similarity can be declared even when R is compared with R. To further illustrate the effect of the high variability on the conclusion of biosimilarity, and how the biosimilarity index addresses the degree of similarity, we consider example data with a total sample size of 40 and coefficients of variation of 45%, again assuming no true mean difference.
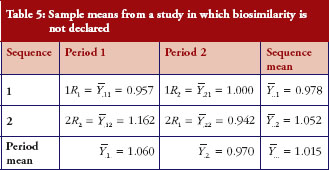
First, we obtain an example where H0 is not rejected and give the sample means in Table 5. The observed mean difference ![]() and the observed variability
and the observed variability ![]() . The 90% confidence interval of the mean difference is (-0.065, 0.327); similarity is not declared.
. The 90% confidence interval of the mean difference is (-0.065, 0.327); similarity is not declared.
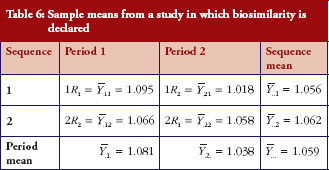
Under the same setting, another set of data is generated. Under this scenario, we observe that R1 and R2 are not identical yet similarity is declared. The sample means are given in Table 6, from which we could calculate the sample mean difference ![]() and the variability
and the variability ![]() . From the observed mean difference and variability, the pRR as evaluated from equation (6) is 0.563. This example shows that when coefficients of variation is high, even though biosimilarity is declared based on the average similarity criterion, the degree of similarity as measured by biosimilarity index is low, so is the confidence that we have in the biosimilarity conclusion.
. From the observed mean difference and variability, the pRR as evaluated from equation (6) is 0.563. This example shows that when coefficients of variation is high, even though biosimilarity is declared based on the average similarity criterion, the degree of similarity as measured by biosimilarity index is low, so is the confidence that we have in the biosimilarity conclusion.
Conclusion
The simulation studies have shown that, as variance increases, the probability of declaring biosimilarity in the Step 1 test decreases; and, for those trials that pass the Step 1 test, the degree of similarity, quantified by biosimilarity index, decreases. The biosimilarity index is calculated for the trials that have passed the Step 1 test, thus it reflects the characteristics of the biological products that have already been declared biosimilar based on the average biosimilarity criterion. To apply the biosimilar index approach, an appropriate p0, see Table 1 for details of Step 3 in the testing procedure, needs to be determined. We recommend p0 = 0.7pRR or 0.8pRR, such that the comparison is relative to the reference products. If we define d = p0/pRR, then d can be used to address the degree of similarity and the question of ‘how similar is highly similar?’ Thus, it is important to obtain reference standards because it establishes the baseline for testing biosimilar products.
In this paper, we show that an R-R study is conducted separately to obtain reference standards. Reference standards can also be established concurrently using the three-arm study as proposed by Kang and Chow [2]. In the three-arm study, participants are randomly assigned to be treated with either test product (T) in one arm, or two different reference products (R1, R2) in the other two arms, such that reference standards are established concurrently in the two reference arms and used as baseline for the test product.
The idea as outlined in this paper can be applied to establish reference standards for biosimilarity index developed based on other criteria for the assessment of biosimilarity. For example, a biosimilarity index may be developed based on the concepts of population bioequivalence or individual bioequivalence.
Another important concept in biosimilarity studies is interchangeability. To assess interchangeability, it needs to be shown that the risk, i.e. safety or diminished efficacy of alternating or switching between use of the biosimilar and the reference product, are not greater than the risk of using the reference product without such alternation or switch. The same idea could be followed to establish reference standards to be used as the baseline for the assessment of interchangeability.
Acknowledgement
This work was partially supported by National Institutes of Health grants P01 CA142538 to Associate Professor Jung-Ying Tzeng.
Competing interests: None.
Provenance and peer review: Not commissioned; externally peer reviewed.
Co-authors
Associate Professor Jung-Ying Tzeng, Department of Statistics and Bioinformatics Research Center, North Carolina State University, Raleigh, NC 27607, USA
Professor Shein-Chung Chow, Professor of Biostatistics and Bioinformatics, Department of Bioinformatics and Biostatistics, Duke University School of Medicine, Suite 1102, Hock Plaza, 2424 Erwin Road, Durham, NC 27705, USA
References
1. U.S. Food and Drug Administration. Draft guidance for industry. Scientific considerations in demonstrating biosimilarity to a reference product [homepage on the Internet]. 2012 Feb [cited 2013 Jun 10]. Available from: http://www.fda.gov/downloads/Drugs/GuidanceComplianceRegulatoryInformation/Guidances/UCM291128.pdf
2. Kang SH, Chow SC. Statistical assessment of biosimilarity based on relative distance between follow-on biologics. Stat Med. 2013;32(3):382-92.
3. Chow SC, Endreny L, Lachenbruch PA, Yang LY, Chi E. Scientific factors for assessing biosimilarity and drug interchangeability of follow-on biologics. Biosimilars. 2011;1:13-26.
4. Chow SC, Ju C. Assessing biosimilarity and interchangeability of biosimilar products under the Biologics Price Competition and Innovation Act. Generics and Biosimilars Initiative Journal (GaBI Journal). 2013;2(1):20-5. doi:10.5639/gabij.2013.0201.004
5. Hsieh TV, Chow SC, Yang LY, Chi E. The evaluation of biosimilarity index based on reproducibility probability for assessing follow-on biologics. Stat Med. 2013;32(3):406-13.
6. Schuirmann DJ. A comparison of the two one-sided tests procedure and the power approach for assessing the equivalence of average bioavailability. J Pharmacokinet Biopharm. 1987;15(6):657-80.
7. Shao J, Chow SC. Reproducibility probability in clinical trials. Stat Med. 2002; 21(12):1727-42.
8. Chow SC, Yang LY, Starr A, Chiu ST. Statistical methods for assessing interchangeability of biosimilars. Stat Med. 2013;32(3):442-8.
9. Chow SC, Liu PB. Design and analysis of bioavailability and bioequivalence studies. 3rd ed. New York: Taylor and Francis; 2008.
|
Author for correspondence: Aijing Zhang, PhD, 5109 SAS Hall, 2311 Stinson Drive, Raleigh, NC 27695, USA |
Disclosure of Conflict of Interest Statement is available upon request.
Copyright © 2013 Pro Pharma Communications International
Permission granted to reproduce for personal and non-commercial use only. All other reproduction, copy or reprinting of all or part of any ‘Content’ found on this website is strictly prohibited without the prior consent of the publisher. Contact the publisher to obtain permission before redistributing.