On statistical evaluation for interchangeability of biosimilar products
Published on 2022/08/01
Generics and Biosimilars Initiative Journal (GaBI Journal). 2022;11(2):51-6.
Author byline as per print journal: Yuqi Li, BS Pharm; Shein-Chung Chow, PhD
|
Abstract: |
Submitted: 30 June 2022; Revised: 28 July 2022; Accepted: 29 July 2022; Published online first: 11 August 2022
Introduction
Biological products are typically large, complex, biologically active molecules produced by living systems, such as micro-organisms, plants or animal cells. These bioproducts are diverse and they may have preventive, diagnostic and therapeutic functions for diseases. Unlike chemical drugs made by non-biological, synthetic processes, biological products which are complex biomolecules, the manufacture of which produces some expected slight differences. Biological products are regulated by the US Food and Drug Administration (FDA), and the review and evaluation of manufacturing performed by FDA can help ensure that the produced biological products have consistent clinical performance [1]. Reference products are biological products approved by FDA based on extensive pre-clinical and clinical safety and efficacy data. A biosimilar product is defined as a biological product that is highly similar to an existing reference product in structure and function and has no clinical difference in terms of safety, purity or potency [1].
As an increasing number of biosimilars become available on the market, more drug use options are provided by introducing competition, the cost of treatment has been reduced. Thus, the medical treatments have become more accessible to patients. Given the availability of numerous options for drug use, it is natural to consider the issue of interchangeability between biosimilars. As indicated in the additional requirements by the Biologics Price Competition and Innovation Act of 2009 (BPCI Act) [2], a proposed biosimilar product which is considered to be an interchangeable biosimilar product for a reference product must satisfy two criteria. First, the biosimilar product can be expected to ‘produce the same clinical result as the reference product in any given patient’. Second, the risk regarding safety and reduced efficacy of switching or alternating between the reference and the interchangeable biosimilar product is not greater than the risk of using the reference product without switching or alternating. The demonstration of a proposed interchangeable biosimilar product is highly similar to a reference product in producing clinical results. In other words, the proposed biosimilar can meet the criteria, and a valid clinical trial design such as a crossover design must be conducted [3].
Considering the first criterion, in practice, it is impossible to demonstrate that a proposed interchangeable biosimilar product can produce the same clinical result as the reference product in any given patient. This could be due to various reasons, such as the fact that the underlying pathology and physiological conditions are not identical in each patient, and the fact that there are slight, acceptable within-product differences in the manufacturing process of the biological product from batch to batch. However, it is statistically possible to demonstrate that the interchangeable biosimilar can produce the same clinical result as the reference product in any given patient with certain assurance. Towards this goal, we mainly focused on the first criterion, and we proposed a statistical approach by evaluating the probability that reference and test products produce the same clinical results in any given patient. When this probability exceeds a prespecified threshold, we then claim that the biosimilar product is interchangeable.
In section 2, some rules regarding clinical data and basic study designs for switching/alternation in interchangeable biosimilar products are introduced. In section 3, statistical methods for estimating the proposed probability, which is referred to as an interchangeability index, are derived theoretically. In section 4, extensive simulation studies are performed to evaluate the proposed method. In section 5, conclusions are provided based on the methods and simulation study results.
Criteria and study design
Log-transformed data and therapeutic index limit
Given the clinical results are considered in related studies, pharmacokinetic data are typically collected usually to assess the interchangeability using statistical methods with some prespecified criteria. The raw pharmacokinetic data may often not be symmetrically or normally distributed, and a large range of the data may be noted. To address these issues and to make it easier to process the data for biostatistics analysis, FDA 1992 and 2001 guidance [4, 5] suggest considering the logarithmic transformation of pharmacokinetic data. Log-transformed data do not change the nature of the data or the correlations between variables. Rather, this transformation compressed the range of the data, making it easier to perform statistical analysis, and the effect of outliers is also reduced [5]. In practice, log-transformed pharmacokinetic data tend to have normal or approximately normal distributions, representing another important reason for the use of logarithmic transformation of data. The standard deviation of log-transformed data is often 1% of the standard deviation of the raw data. In addition, the logarithmic transformation could almost eliminate the problem of heteroskedasticity in the analysis.
Recall that our goal is to evaluate the probability that a biosimilar product produces the same clinical results in any given patient as a reference product. Although it is unlikely that the two products will produce identical clinical outcomes, the clinical results from the two products are probably within a narrow limit. Considering the ratio of the clinical outcomes, which are numeric data, if the clinical results are almost identical, the ratio should be close to 1. A limit of the therapeutic index can be set for the ratio. That is, if the ratio is within a narrow limit including 1, we may consider the two products as interchangeable. Since the log-transformed data are used in the analysis, the limit of the therapeutic index between the reference and biosimilar product should satisfy L1 × L2 = 1, thus there will be symmetric limits within the log-transformed space. Of course, given that biological products target a large population, in addition to the mean of clinical results, the variability due to subject-by-product should also be considered. We will discuss this information in later sections.
Switching design
As noted in the introduction, to determine whether a proposed biological product is an interchangeable biosimilar product, a valid clinical study design is necessary. FDA defines the switching as a single switch, whereas alternation is defined as multiple switches between two biological products, respectively [3]. An adequate design can be useful to evaluate whether a proposed biosimilar product can produce the same clinical result in any given patient as a reference product and evaluate the risk in terms of efficacy and safety with or without switching/alternation.
The FDA guidance about biosimilar interchangeability recommends a 2 × (m + 1) crossover design [3], where m is the number of switches. For a single switch, an adequate crossover design consists of two sequences which are RT and RR, where R represents the reference product and T represents the test product. This design is denoted by (RT, RR), which can evaluate the effect and safety of the switch from R to T and no switch. The relative risk of product use between the switch and no switch can also be assessed. When more than one switch occurs (m ≥ 2), a 2 × (m + 1) crossover design is still necessary. For example, when it switches twice (m = 2), a 2 × 3 crossover design consists of the two sequences which are RTR and RRR. This design is denoted by (RTR, RRR). This design is able to evaluate the efficacy of the switch from R to T and then to R and the efficacy of no switch. The relative risk can also be estimated under the study design.
In this case, in addition to the 2 × (m + 1) crossover design, a n-of-1 trial design has become an alternative popular design in recent years [6]. In a n-of-1 trial, a single subject is the entire trial. Random allocation is used to determine the order of the treatments given to a subject. This trial can be used to evaluate the difference in treatment effect within the same individual when multiple treatments are assigned at different periods. [7, 8] In fact, the n-of-1 trial has a nature of crossover design which can assess the relative risk between switching/alternation and without switching/alternation.
Statistical method
Interchangeability index
Without loss of generality, we assume that the data from clinical trials have been logarithmically transformed and follow a normal distribution with specified mean and variance. Let YR and YT be the clinical results of the reference product and the test product, where R = log YR and T = log YT follow normal distributions with means µR, µT and variances σ2R, σ2T, respectively. Referring to the idea of using P(X < Y) [9, 10] to assess the interchangeability between two biological products, we propose the following probability as an index to evaluate the consistency of the clinical results of the reference and test products:

Where 0 < L1 < 1 and L2 > 1, L1 and L2 are defined as the acceptable lower bound and upper bound of the therapeutic index, respectively. Based on the characteristics of logarithm transformation, the limit of therapeutic index between the reference and biosimilar product should satisfy L1 × L2 = 1, then the transformed limits will have the same distance to 0 (after log-transformation, log 1 = 0 ). The proposed interchangeability index refers to the probability p. Denoting F as the ratio of YT and YR , as F converges to 1, p tends to 1. The probability p converging to 1 indicates that the two products can be considered as identical in terms of producing clinical results. The ratio F converging to 1 will require a high degree of clinical consistency between the two products for any given patient, which is usually diffi cult to realize in practice.
Estimate of interchangeability index
Under the normal distribution assumption of R = log YR and T = logYT, where R ~ N (µR, σ2R) and T ~ N (µT, σ2T), the probability p can be derived as the form below:

where Φ(z0) = P (Z < z0), Z is a standardized normal random variable. Thus, the interchangeability index p is a function of the parameters ~θ = (µT, µR, σ2T, σ2R). Assuming that in a study design, the observations are presented by Ri = log YRi, i = 1, …, nR and Ti = log YTi, i= 1, …, nT. Then the maximum likelihood estimator (MLE) of the probability p can be derived as following:

Based on the normality and large sample assumptions, there are still some asymptotic statistical results holding. Since the derived formula for the estimate of p is very complex, we consider using the Taylor expansion formula to approximate p locally. Recall that:

Applying Taylor expansion of  at p, in other words, at X = Xk = (μT, μR, σ2T , σ2R), we can get:

Where H (Xk) is Hessian Matrix.
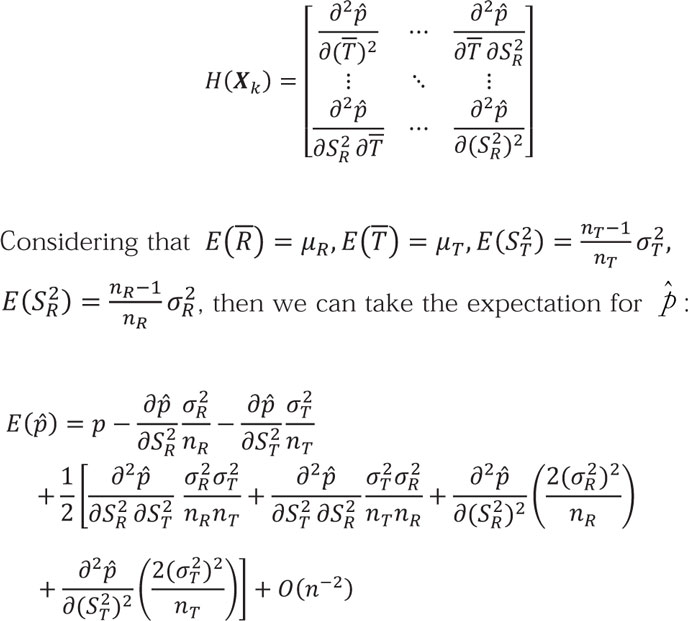
We can further derive the first term of this Taylor expansion as the leading term. In addition, to simplify this case, we will only focus on the leading term in expectation, so that the expectation for can be rewritten as the following formula:

Following the same idea, we can also get the variance of :

To simplify these formulas, let E() = p + B(p) + O(n–2), where B(p) is the leading term in the expectation formular mentioned above and is also the bias between and p. Since O(n–2) is the reminder term, in statistics we can omit its effect. Similarly, let Var () = C(p) + O(n–2), where C(p) is the leading term of Var ().
Since we assume the large sample in study, using Slutsky’s Theorem,

In this situation, applying the expectation and variance derived above, we can furthermore derive that:

where B() and C() are the estimates of B(P) and C(P). As the sample size increases to infinity, B(P) converges to 0 and then will be asymptotically unbiased.
Based on these theorems above, an approximate (1 – α) 100% confidence interval (CI) for the interchangeability index P) and C(P can be obtained. Since the proposed probability indicates to what extent the test and reference products are identical, in other words, interchangeable, in terms of producing clinical results in comparable population, we only focus on the lower bound of the confidence interval. Thus, we can construct a one-side (1 – α) 100% CI for interchangeability index P as following:

Based on the data from a switching design, we can calculate , the point estimate, and L(), the lower bound of a one-sided (1 – α) 100% CI for the interchangeability index p. Given significance level α and a pre-specified threshold β, we can compare β and L(). If L() ≥ β, we could conclude that the test and reference biological products are interchangeable.
Simulation study
For a valid statistical analysis of biosimilar interchangeability, it is necessary to perform the statistical procedure under some prespecified acceptance criteria. We will construct a 95% CI for the proposed interchangeability index described previously. If the 95% CI lower bound is greater than a prespecified threshold β for interchangeability, we will claim that the test product is interchangeable for the reference product.
In this section, we will perform simulation studies to evaluate the performance of the proposed statistical method regarding interchangeability. We will specify different distribution parameters for the normal distribution to generate simulated experimental log-transformed pharmacokinetic data, perform statistical analysis on these data to calculate the interchangeability index and its one-sided 95% CI, and further explore the influence of the distribution parameters on the statistical results and threshold selection based on these simulations, and select the sample size for different data and thresholds.
First, we need to clarify some denotations and assumptions in this study:
(1) To provide a more specifi c context for the simulation study, we try to set concrete therapeutic index limits (L1 and L2). Considering L1 × L2 = 1, to make our simulation study more general without fi rst setting a harsh criterion, in this case, we will propose L1 = 0.8 and L2 = 1.25.
(2) Let F = YT/YR, where YT and YR are the means of the clinical results produced by test and reference products, respectively. When F ∈ (0.8, 1.25) is in fact, it is possible that the two products could be claimed to be interchangeable.
(3) We will assume nT = nR= n in the switch design given that crossover trial designs typically enrol a similar number of comparable subjects for both sequences.
(4) We will assume σT = σR = σ given that the logarithmic transformation substantially reduces the variance of the data, so the variance of the transformed data should be approximately the same for pharmacokinetic data from comparable populations.
Average probability and the lower bound of 95% CI
Given the different ratios of YT and YR (ranging from 0.75 to 1.30) and different standard deviations of the log-transformed data which are normally distributed (ranging from 0.01 to 0.07). We chose the sample size nT = nR = 100. As mentioned in section 2.1, logarithmic transformation can reduce the standard deviation to approximately 1% of that of the raw data, thus we select this range of σ. In addition, regardless of the scale of the raw data, as long as the ratio of YT and YR is the same, this ratio will become the same difference after logarithmic transformation. Thus, the scale of the data has no effect on the results of the simulation study. The data were generated based on the prespecified parameters F and σ for 5,000 times, and the the average probability p (interchangeability index) and the lower bound of the 95% CI were calculated.
The results of simulation 1 are presented in Table 1.
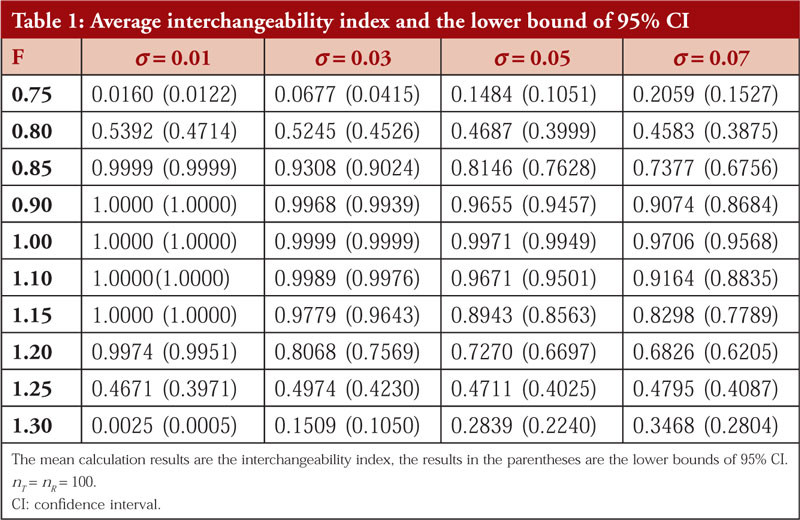
From the simulation results, we found that the interchangeability index decreases rapidly with increasing variance, meaning that a larger variance decreases the probability of two products being evaluated as interchangeable, even if the ratio of their means of clinical results is in the range of 0.8 to 1.25. It is reasonable because if a biological product produces a relatively large variance in clinical outcomes, it is an indication that it is not therapeutically stable and therefore will not be easily considered interchangeable.
Considering that σ = 0.07 expands one hundredfold to 7 as the standard deviation of the raw pharmacokinetic data, i.e., the coefficient of variation (CV) = 7%. This number represents a large variance and the lower bound of the CI is less than 90% for both cases with ratios of 0.9 and 1.1. Thus, we will not consider such a large standard deviation in subsequent simulation studies. For σ = 0.01, this standard deviation is so small that it means that the fluctuations in the data are minimal as long as the mean ratio of the clinical results produced by two products is within the range of 0.8 to 1.25 (not too close to the boundary). In addition, the interchangeability index is very high, and the test product is claimed to be interchangeable for the reference product. Thus, we will also not consider such a small standard deviation in further simulation studies.
Regardless of the chosen standard deviation, as long as the ratio F is outside the range of 0.8 to 1.25, the calculated interchangeability index is extremely small, indicating that such test products cannot generally be considered interchangeable under this statistical method. Thus, so we do not need to study the ratios outside the range of 0.8 to 1.25. In other words, this statistical method can well ensure that non-interchangeable products will not be claimed to be interchangeable. For the data in which the ratio is within the range from 0.9 to 1.1, as long as the standard deviation is not too large (e.g. σ = 0.07), the test products can be evaluated as interchangeable products for reference products under this statistical method. Thus, we do not need to continue to investigate the statistical results in this ratio range.
For further studies, we only need to focus on cases where the ratio F is between 0.8 and 0.9, 1.0 and 1.25, and only assume that the standard deviation of the log-transformed data is in the range of 0.3 to 0.5. Data with such characteristics are more meaningful for assessing the performance of this statistical method.
Changing the sample size
Based on the results of simulation 1, in this simulation we focused on statistics corresponding to variance and ratios in a specific range and evaluated the performance of our statistical method. Additionally, considering that the sample size affects the accuracy of the statistical results, this study sets different sample sizes for the calculation of the interchangeability index. Given that we expect the lower bound of the 95% CI of the interchangeability index to determine whether two products are interchangeable, we will only report the lower bound of the one-sided 95% CI in this study. Similarly, for each simulation, the process is performed 5,000 times. The chosen parameters and the results are presented in Table 2.

Overall, given the variance and ratio, the interchangeability index almost still increases as the sample size increases within a certain range. When the sample size exceeds 100, the increase in the interchangeability index becomes unobvious. When the sample increases further, the value of the index almost just fluctuates without a significant increase. Therefore, considering that the switch design for biosimilar product interchangeability is usually a crossover design, a sample size of approximately 100 subjects for each sequence is appropriate based on the simulation results. Similar to the findings of simulation 1, the interchangeability index is lower when the ratio is close to 0.8 or 1.25. In general, this value cannot be increased significantly by increasing the sample size. According to the results of this simulation study, when the standard deviation is small (0.03), the interchangeability index has a relatively high probability of being greater than 80% if the ratio is in the range of 0.85–1.20. When the standard deviation is slightly larger (0.05), the interchangeability index can only reach a level of approximately 70% if the ratio is approximately 0.85 and 1.20. It is understandable that when the variance increases, the more the clinical outcomes produced by the biological product in patients fluctuate, the less likely it is to be assessed as interchangeable with the reference product.
Conclusion and discussion
For the assessment of drug interchangeability of biosimilar products, in practice, it is impossible to demonstrate that the test product can produce the same clinical therapeutic effect as that of the reference product given the difference in patients’ conditions and manufacturing differences and so on. In this article, we provided a statistical assurance that “test product has the same therapeutic effect as that of the reference product with certain assurance”. In other words, this statistical analysis assures a high probability that test product has the same therapeutic effect in any given patient, thus supporting the claim of interchangeability between test and reference products. For this purpose, following a similar idea of Chow et al. [10], a statistical method is proposed to estimate the probability of the two products producing the same clinical results (with an acceptable difference in a narrow limit).
In the simulation studies, we used 0.8 and 1.25 as the therapeutic index limits in reference to the 80/125 rule in bioequivalence for generic drugs. Indeed, the interchangeability of biosimilar products is not the same as bioequivalence of generic drugs, but similarities are noted to some extent. In practice, based on the definition of interchangeable biosimilar products, the limits might be narrower than 0.8 and 1.25. The simulation results indicate that for a ratio of two product means between 0.85 and 1.20, when the variance is not too large, the value of the interchangeability index can basically achieve 80% or greater with suitable sample size. That is, if we set an appropriate value to the threshold, the interchangeability index can be used to assess whether two biological products are interchangeable based on the data of the exchange design. However, it is difficult to claim that two products are interchangeable by calculating the interchangeability index when the clinical effects of the products fluctuate widely (large variance due to subjects by product) or when the ratio of the mean values of the two products is close to 0.8 or 1.25. For such a test product, the statistical method proposed in this study cannot yet be used as a valid evaluation tool, but this is an indicating the conservative nature of this statistical standard.
Further scenarios regarding this statistical method should be considered. Regardless of how we increase the sample size to the extent feasible in clinical trials, the value of the interchangeability index is well below 80% when the ratio is near 0.8 or 1.25. This finding is understandable. Consider a product tested has a mean clinical effect of 80% of the mean of the reference product, but the data fluctuate between patients. Here, the clinical effect produced in a large proportion of subjects will be less than 80% of the reference product. Thus, it is difficult for such a product to be recognized as interchangeable. The same is true when the ratio is approximately 1.25. For such a product, how exactly do we determine whether it is interchangeable with the reference product? This also requires further establishment of evaluation criteria based on its characteristics. In summary, the threshold for the interchangeability index and the therapeutic index limit are the main considerations when using this statistical method to claim whether a proposed biosimilar product is interchangeable for a reference product.
This interchangeability index is valid for the evaluation of biological products that meet certain conditions. However, the index in this study is only practical for switch design (a valid crossover design), and this article only addresses the first requirement for interchangeable biosimilar products according to the BPCI Act. The proposed method can be applied to switching design as recommended by FDA. To demonstrate biosimilar interchangeability, we also need to explore the relative risk between the test and reference products by performing study with a switch or alternation design. This requires further research under FDA’s recommended switching designs, either (RTR, RRR) for a single switch or (RTRT, RRRR) for multiple switching (alternation).
Competing interests:None.
Provenance and peer review: Not commissioned; externally peer reviewed.
Authors
Yuqi Li, BS Pharm, Master of Biostatistics candidate, BS Pharm
Department of Biostatistics and Bioinformatics, Duke University School of Medicine, Suite 1102, Hock Plaza, 2424 Erwin Road, Durham, NC 27705, USA
Professor Shein-Chung Chow, PhD
Department of Biostatistics and Bioinformatics, Duke University School of Medicine, Suite 1102, Hock Plaza, 2424 Erwin Road, Durham, NC 27705, USA
References
1. U.S. Food and Drug Administration. Guidance on scientific considerations in demonstrating biosimilarity to a reference product. April 2015 [homepage on the Internet]. [cited 2022 Jul 28]. Available from: https://www.fda.gov/regulatory-information/search-fda-guidance-documents/scientific-
considerations-demonstrating-biosimilarity-reference-product
2. U.S. Food and Drug Administration. Biologic Price, Competition, and Innovation Act of 2009. 2009 [homepage on the Internet]. [cited 2022 Jul 28]. Available from: https://www.fda.gov/media/78946/download
3. U.S. Food and Drug Administration. Guidance for industry—considerations in demonstrating interchangeability with a reference product. 2019 [homepage on the Internet]. [cited 2022 Jul 28]. Available from: https://www.fda.gov/regulatory-information/search-fda-guidance-documents/considerations-demonstrating-interchangeability-reference-product-guidance-industry
4. National Technical Reports Library. Guidance for Industry. Statistical approaches to establishing bioequivalence [homepage on the Internet]. [cited 2022 Jul 28]. Available from: https://ntrl.ntis.gov/NTRL/dashboard/searchResults/titleDetail/PB2010104191.xhtml
5. U.S. Food and Drug Administration. Guidance on statistical approaches to establishing bioequivalence. 2001 [homepage on the Internet]. [cited 2022 Jul 28]. Available from: https://www.fda.gov/regulatory-information/
search-fda-guidance-documents/statistical-approaches-establishing-bioequivalence
6. Chow SC, Song F, Cui C. On hybrid parallel–crossover designs for assessing drug interchangeability of biosimilar products. J Biopharm Stat. 2017;27(2):
265-71.
7. Lillie EO, Patay B, Diamant J, Issell B, Topol EJ, Schork NJ. The n-of-1 clinical trial: the ultimate strategy for individualizing medicine? Per Med. 2011;8(2):161-73.
8. Davidson KW, Cheung YK, McGinn T, Wang YC. Expanding the role of n-of-1 trials in the precision medicine era: action priorities and practical consideration. National Academy of Medicine. 2018. https://doi.org/10.31478/201812d
9. Jacobs R, Bekker AA, van der Voet H, Ter Braak CJF. Parametric estimation of P(X > Y) for normal distributions in the context of probabilistic environmental risk assessment. PeerJ. 2015;3:e1164.
10. Tse SK, Chang JY, Su WL, Chow SC, Hsiung C, Lu Q. Statistical quality control process for traditional Chinese medicine. J Biopharm Stat. 2006;16(6):861-74.
|
Author for correspondence: Yuqi Li, BS Pharm, Department of Biostatistics and Bioinformatics, Duke University School of Medicine, 2424 Erwin Road, Durham, NC 27705, USA |
Disclosure of Conflict of Interest Statement is available upon request.
Copyright © 2022 Pro Pharma Communications International
Permission granted to reproduce for personal and non-commercial use only. All other reproduction, copy or reprinting of all or part of any ‘Content’ found on this website is strictly prohibited without the prior consent of the publisher. Contact the publisher to obtain permission before redistributing.