Variation in the prices of oncology medicines across Europe and the implications for the future
Published on 2021/02/03
Generics and Biosimilars Initiative Journal (GaBI Journal). 2021;10(2):72-82.
Author byline as per print journal:
Brian Godman1,2,3, BSc, PhD; Steven Simoens4, MSc, PhD; Amanj Kurdi1,5, BSc, PhD; Gisbert Selke6; John Yfantopoulos7, PhD; Andrew Hill8, PhD; Jolanta Gulbinovič9, MD, PhD; Antony P Martin10,11, MA, PhD1; Angela Timoney1,12, BPharm, PhD; Dzintars Gotham13, MBBS; Janet Wale14, PhD; Tomasz Bochenek15, PhD; Iva Selke Krulichova16, MSc, PhD; Eleonora Allocati17, MSc; Iris Hoxha18; Admir Malaj19; Christian Hierlander20; Anna Nachtnebel20, MSc, MD; Wouter Hamelinck21, MSc; Zornitza Mitkova22, PhD; Guenka Petrova22, PhD; Ott Laius23, PhD; Catherine Sermet24, MD, PhD; Irene Langner6; Roberta Joppi25, PhD; Arianit Jakupi26; Elita Poplavska27, PhD; Ieva Greiciute-Kuprijanov28; Patricia Vella Bonanno1, PhD; JF (Hans) Piepenbrink29; Vincent de Valk29; Robert Plisko30, Magdalene Wladysiuk30, MD, PhD; Vanda Marković-Peković31, PhD; Ileana Mardare32, PhD; Tanja Novakovic33; Mark Parker33; Jurij Furst34; Dominik Tomek35, PharmD, MSc, PhD; Katarina Banasova36; Merce Obach Cortadellas37; Corrine Zara37; Caridad Pontes37,38; Maria Juhasz-Haverinen39, MScPharm; Peter Skiold40, BSc; Stuart McTaggart41; Durhane Wong-Rieger42; Stephen Campbell43,44, PhD; Ruaraidh Hill45, PhD
|
Introduction/Objectives: Health authorities are facing increasing challenges to the sustainability of their healthcare systems because of the growing expenditures on medicines, including new, high-priced oncology medicines, and changes in disease prevalence in their ageing populations. Medicine prices in European countries are greatly affected by the ability to negotiate reasonable prices. Concerns have been expressed that prices of patented medicines do not fall sufficiently after the introduction of lower-cost generic oncology medicines. The objective of this study was to examine the associations over time in selected European countries between the prices of oral oncology medicines, population size, and gross domestic product (GDP) before and after the introduction of generic versions. Evidence of periodic reassessments of the price, value, and place in treatment of these medicines was also looked for. The goal of this review was to stimulate debate about possible improvements in approaches to reimbursement negotiations. |
Submitted: 11 October 2020; Revised: 21 January 2021; Accepted: 21 January 2021; Published online first: 3 February 2021
Introduction/Objectives
Globally, increases in expenditure on medicines has accelerated in recent years. Expenditures have been driven principally by increased prescribing volumes and the high prices of new medicines, especially those for oncology and orphan diseases [1-4]. The prices of new oncology medicines have risen ten-fold or more during the last decade [5-8], with prices per life year gained rising four-fold during the last twenty years after adjusting for inflation [6, 9]. As a result, expenditure on oncology medicines now dominates pharmaceutical expenditure in high income countries. Expenditure is expected to accelerate as there are over 500 companies actively pursuing new oncology medicines for over 600 indications [10, 11], all with high price expectations [12, 13]. The continuously rising cost of cancer care already accounts for up to 30% of the total hospital expenditure across Europe [14, 15], and global expenditure on oncology medicines is estimated to reach US$237 billion by 2024 [16].
This growth is putting considerable strain on universal access to European healthcare systems [4, 13, 17, 18]; leading to increasing calls for prices to be linked to minimum improvements in clinical benefits, such as a minimum of three to six months additional survival [19-23]. Such linkage would reverse recent policies in European countries (based on the emotive nature of this disease area) that have funded payments even for new, high-priced cancer medicines that offer limited health gains [12, 24]. Sustainability concerns have led to world-wide calls for alternative pricing and funding approaches to new oncology medicines, including fair pricing models [25-30]. Fair pricing models necessarily include greater transparency in how prices are set; a goal of the World Health Organization (WHO).
WHO has called for improved access to new medicines for all patients, including those with cancer [31, 32]. Calls for fairer pricing of new medicines are growing; based on recognition of both the low production cost of some cancer medicines (due to low costs of raw materials and improved manufacturing), and the appreciable discounting of original biological medicines by pharmaceutical companies that have occurred after the introduction of biosimilar competition [33-35].
Excessive pricing is particularly problematic in the US where prices for both existing on-patent oncology medicines as well as new cancer medicines continue to increase rapidly as a result of a lack of formal pricing and reimbursement processes. US oncologists have requested price moderation for new oncology medicines [36]; however, this has failed to materialize. By recent estimates, net expenditure in the US would be US$39.5 billion for 46 new oncology medicines approved in 2018 (17 novel medications and 29 new indications for existing medications), if all eligible patients received them [37]. Potential expenditure in 2018 on oncology medicines in the US could have been even greater, as this figure does not include the cost of other oncology medicines [37].
In Europe, when prices for medicines are established, there appears to be limited price erosion until multiple source products become available. This is unlike the situation in the US [38, 39]. There also appear to be limited differences between European countries regarding prices for patented biological oncology medicines. For example, it was reported that there was only a 13% difference between the prices for various medicines, including bevacizumab and ipilimumab, across 16 European countries while there were much greater differences for lower-priced medicines [40]. Similarly, limited differences were observed in the monthly treatment costs for new oncology medicines among European countries. However, the costs of medicines in the US were a median of 2.31 times higher than those seen in Europe, reflecting the current lack of pricing controls in the US [39, 41]. The situation in Europe may reflect extensive external reference pricing for new medicines [30, 42], although considerable differences in the pricing of multi-sourced oncology medicines exist among European countries [34].
Prices of cancer medicines have recently been reviewed in a number of publications [38, 40, 41]. There is a need to build on these findings to provide useful guidance for health authorities as they struggle with their budgets for oncology medicines. This includes assessing the potential influence of gross domestic product (GDP) and population size on reimbursed prices of patented medicines across Europe. This is important because countries with smaller populations and less economic power could be at a disadvantage during pricing negotiations. If true, this could result in higher negotiated prices despite the existence of extensive external reference pricing data across Europe [41, 42]. These concerns triggered the development of cross-country European consortia, designed to enhance negotiating power for new, premium-priced medicines [43]. These consortia include Beneluxa, Valleta and the Nordic consortium [32, 43-45]. It has been shown that the prices of oral generic cancer medicines were not dependant on the European country’s population size or their economic status and that, over time, appreciable price reductions were observed [34]. However, this trend may be different for on-patent oral cancer medicines.
Given the unsustainability of current systems, it is hoped that this review can stimulate further debate regarding possible new approaches to reimbursement negotiations. Debate should include how the negotiation of prices of existing patented oncology medicines should change after a standard oncology medicine loses its patent protection, potentially appreciably altering the cost-effectiveness ratio of existing patented medicines and their overall value. In addition, the pricing of new, on-patent oncology medicines across Europe should consider the use of fair pricing models. This review builds on current initiatives from WHO, the European Commission, and European insurers, that all call for greater transparency in pricing negotiations [18, 22, 26, 32].
Europe was chosen for study because of its goals of providing equitable and universal healthcare; including for patients with oncologic and rare diseases. Europe has also introduced multiple, ongoing activities designed to improve the quality and efficiency of prescribing of both new and established medicines [20, 21, 30, 46-50]. In addition, European countries have formal pricing and reimbursement processes in place and there are processes in place to review and refine approaches within the jurisdiction of each Member State [30, 39, 51]. This contrasts with the US, which currently has no formal pricing or reimbursement systems in place. As a result of this deficiency, the US is currently responsible for over 40% of global pharmaceutical spending despite having only 4.5% of the world’s population [39].
This study represents a payer perspective since payers are the key stakeholders involved in funding and reimbursement decisions for oncology medicines across Europe. Health authority databases were used as they are regularly audited and reflect the prices paid by health authorities for these medicines with or without value added tax (VAT), depending on the country [34, 52-54].
Methodology
The methodology used has been previously described [34]. The European countries examined were Albania, Austria, Belgium, B&H (Republic of Srpska), Bulgaria, Cyprus, Estonia, France, Germany, Greece, Italy, Kosovo, Latvia, Lithuania, Malta, Netherlands, Norway, Poland, Romania, Serbia, Slovenia, Slovakia, Spain (represented by pricing data from Catalonia with list prices similar across Spain), Sweden, and Scotland [as a representative of the United Kingdom (UK) as tariff prices are consistent across the UK]. The countries chosen include a wide range of geographies, populations, and GDPs. They also provided access to robust data from their administrative databases. Pricing data from health authorities are reliable and robust because their systems are regularly audited [34, 55]. This approach has also been used previously in multiple cross-national publications assessing utilization and expenditure patterns for different medicines and disease areas across Europe [34,52-54, 56-58].
This study concentrated on reimbursed prices for imatinib (L01XE01), erlotinib (L01XE03) and fludarabine (L01BB05) in Western European countries [59]. Generics were unavailable in 2015 for imatinib, and in 2017 for erlotinib and fludarabine. External reference pricing is infrequently used in these countries [34, 42, 52]. The delayed availability of generic versions of these oral cancer medicines in Western European countries provided a longer time period over which any price erosion could be monitored. These data build on earlier findings that involved assessing reimbursed prices for generic busulfan (L01AB01), capecitabine (L01BC06), chlorambucil (L01AA02), cyclophosphamide (L01AA01), flutamide (L02BB01), imatinib (L01XE01), melphalan (L01AA03), and temozolomide (L01AX03) over time across Europe [34].
Reimbursed prices were used where possible. However, in a minority of countries, procured and total prices were used instead (e.g. Kosovo) when it was not possible to break prices down into individual components. Total prices include pharmacy remuneration and any patient co-payments. In some countries, VAT was also included in the price. In some cases it was difficult to determine the exact proportion for each component to the total price from the information provided. Documented prices could also include any discounted prices arising from managed entry agreements (MEAs); sometimes referred to as risk sharing arrangements [50, 60]. However, MEAs were rare for individual oncology medicines in Europe prior to the recent rapid increase in the requested prices for new oncology medicines [60-63]. In some countries, reimbursed prices were listed, but the medicines are typically dispensed in hospitals where further, confidential discounts are provided, such as in Norway and Italy.
Reimbursed prices were generally recorded between 2013 and 2017 and were based on tablet strength. Tablet strengths were chosen for comparative purposes as opposed to defined daily doses (DDDs) used in previous cross-national research [52-54, 56, 57], as generally there are no DDDs for oral cancer medicines [59]. The tablet strength chosen reflects the most commonly used strength.
Initially, prices were documented in the country’s currency if not listed in Euros. Subsequently, where relevant, prices were converted to Euros for comparative purposes based on current exchange rates and were validated by co-authors to enhance the robustness of the findings [34, 64-71]. Prices were then converted to US$ based on mid-year European Central Bank exchange rates for comparison with the Organisation for Economic Co-operation and Development (OECD) GDP per capita data for 2015 and 2017 [72-74]. However, prices were retained in Euros when calculating any price erosion of the on-patent oral oncology medicines over time. Euros were also used for comparing prices of different generic oral cancer medicines, as one of the principal aims of this study was to compare prices across countries, as well to consider any price reductions achieved [34].
The OECD data on GDP per capita in US$ in 2015 and 2017 were supplemented with additional data if OECD data for these years were not available [72], e.g. 2018 OECD data were used for Albania and Cyprus and alternate data sources were used for Kosovo, Malta, Romania, and Serbia [75-78]. For consistency, the OECD data were also used for population sizes in 2015 and 2017; however, data from other sources was also used where required [78-81]. Country abbreviations were based on the International Organization for Standardization abbreviations, see Table 1A in the Appendix, [82].
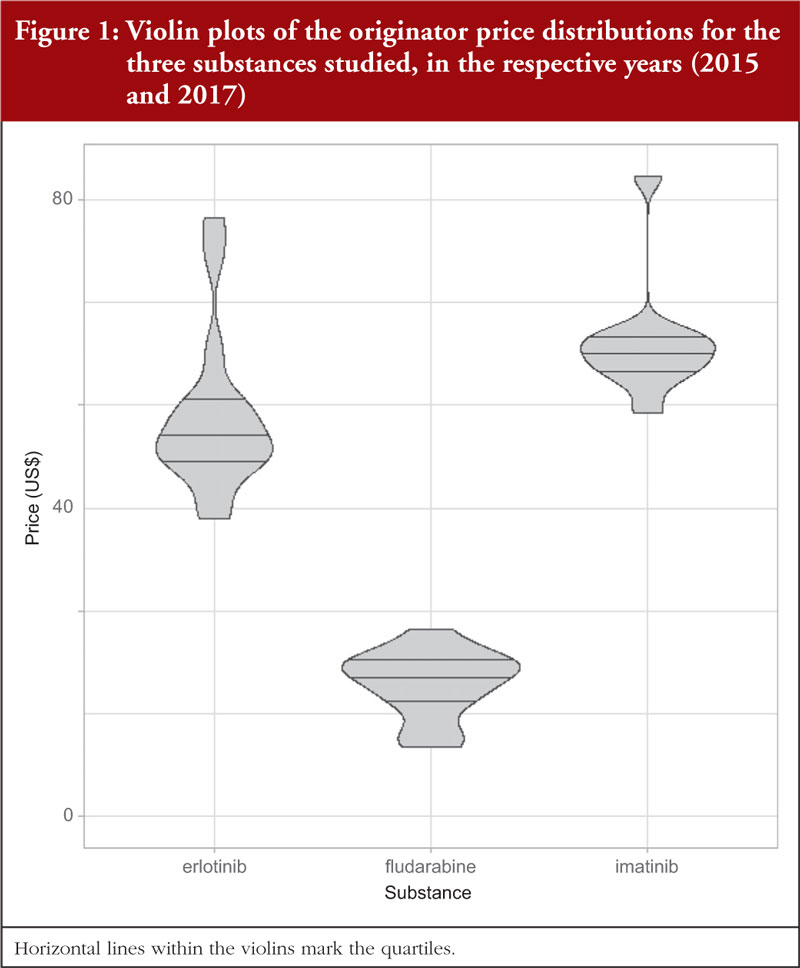
Differences in country prices were visualised as violin plots to enhance interpretation of the data. Non-parametric Spearman’s rank tests were used to assess any correlation between prices and the countries’ population size, as well as their GDP per capita. Correlations were presented as Spearman’s rank correlation coefficients which range from -1 (perfect negative correlation) to +1 (perfect positive correlation). A p-value less than 0.05 was considered statistically significant. No correction for multiple comparisons was made. The correlations were also visually presented using scatter plots. Calculations were performed using R 3.6.1 software [83].
No ethical approval was obtained since only aggregate, anonymised data were used. This is in accordance with methods used in similar studies using administrative databases [34, 46, 53, 56, 84]. The definition of terms used, including external reference pricing, managed entry agreements (MEAs), and value-based pricing, follow those used for reforms and initiatives introduced across Europe [30].
Results
Prices of generic oral cancer medicines across Europe
A prior 2019 study showed that there were variable approaches made to the pricing of generic oral oncology medicines across Europe. This situation is similar for the pricing of other generic medicines [34, 49, 52, 85, 86]. The different approaches used can be consolidated into three categories [34]:
- prescriptive pricing policies (price regulated market): policies using established percentage reductions for successive generics
- market forces (free market): where there is typically free pricing for generics with market forces helping to drive down prices
- mixed approach (combination): that incorporates prescriptive approaches, market forces, and other mechanisms, including external reference pricing, commonly used across Europe.
Differences in the approaches adopted by the various European countries resulted in appreciable differences in the reimbursed prices for generic oral oncology medicines across Europe. In addition, appreciable differences in the price reductions were seen for generic medicines in many European countries versus prices prior to loss of patents, see Box 1.
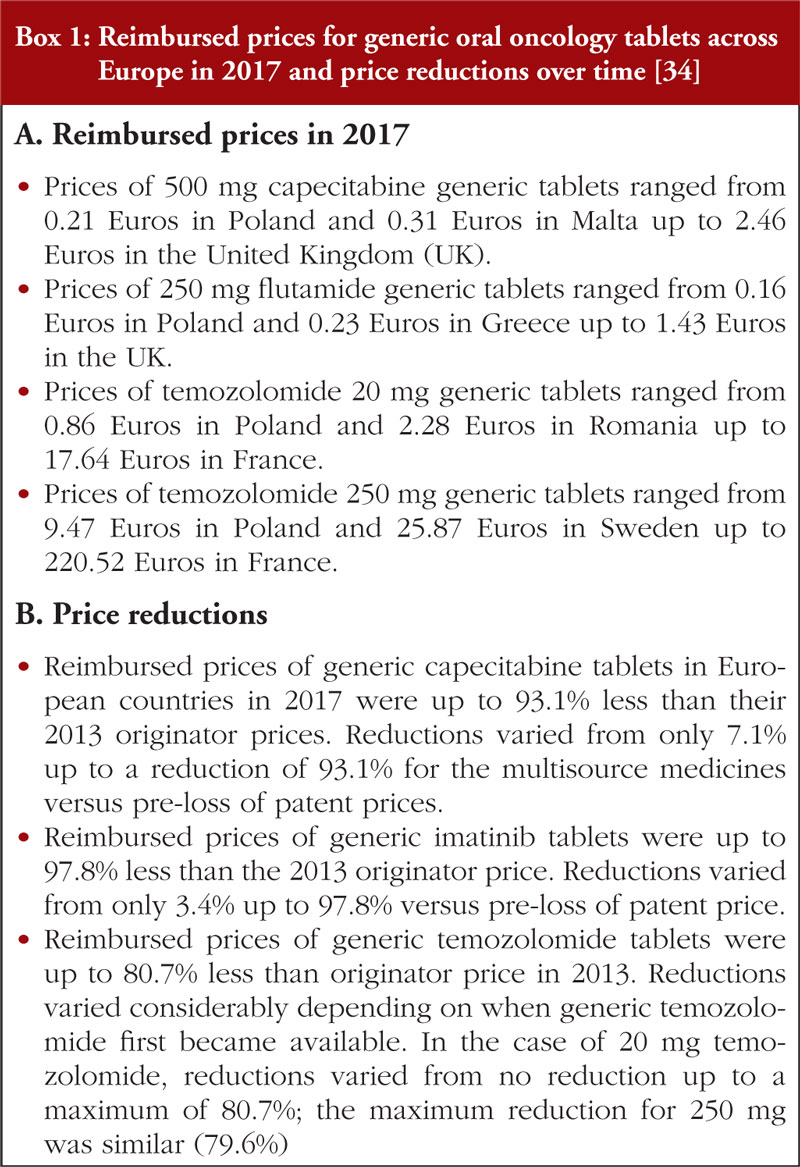
Reimbursed prices were not indication specific, i.e. there were no differential prices once the first indication had lost its patent. In addition, contrary to prior reports [34], the generic oral oncology medicine prices in 2017 did not appear to be correlated with the country’s population size or to its GDP (Central and Eastern Europe (CEE) versus Western European countries). There were also no apparent concerns expressed about substitution with generic oral oncology medicines [34]. This is encouraging as such concerns have been reported to limit the extent of savings possible following the availability of generics [87].
Prices of originator, on-patent oral cancer medicines across Europe
Imatinib
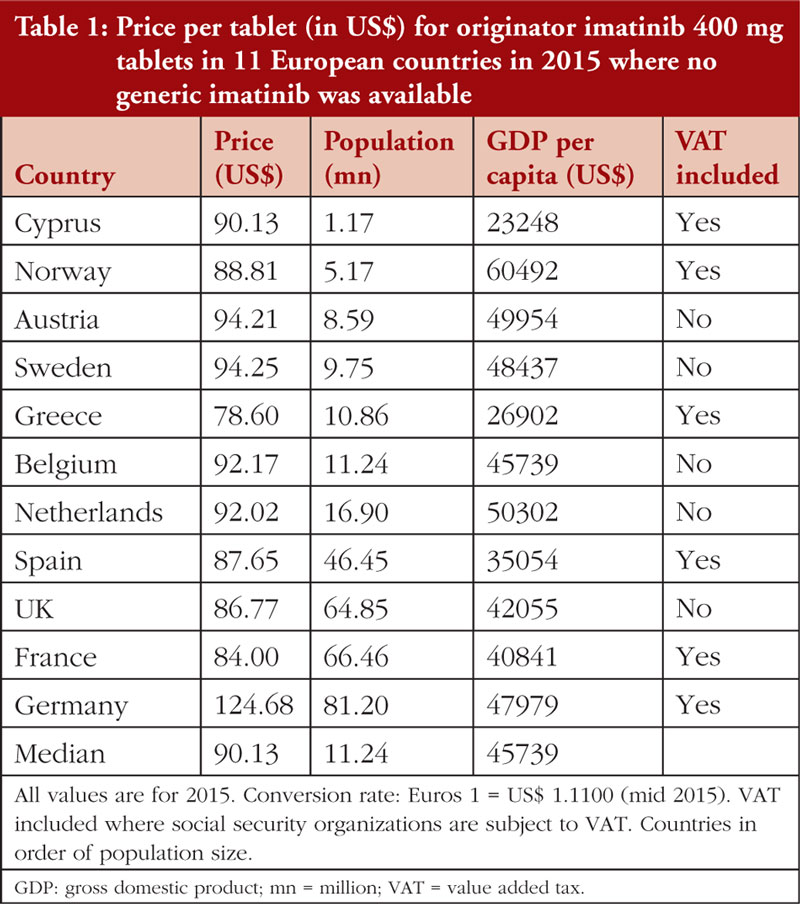
Table 1 documents the prices for originator 400 mg imatinib tablets among Western European countries in 2015 prior to generic availability. Figure 1 presents the range of prices across all the countries studied. Generic imatinib was already available prior to 2015 in CEE countries, e.g. Albania, Estonia, Latvia, Lithuania, Romania, Serbia and Slovakia in 2013 or before, and in Poland and Slovenia in 2014 [34], and originator prices typically fell in these countries when generics became available [34, 49, 85].
While the minimum price of imatinib was 12.8% below the median (US$90.13), and the maximum price 4.6% above the median (excluding the outlier Germany at +38.3%), the results of the Spearman’s rank test indicated no correlation (r = –0.100; p = 0.776) between the price of imatinib and the country’s population size, see Appendix Figure 1 A. However, there was a moderate, statistically insignificant positive correlation (r = +0.527; p = 0.100) between imatinib prices and GDP per capita, see Figure 2.

Erlotinib
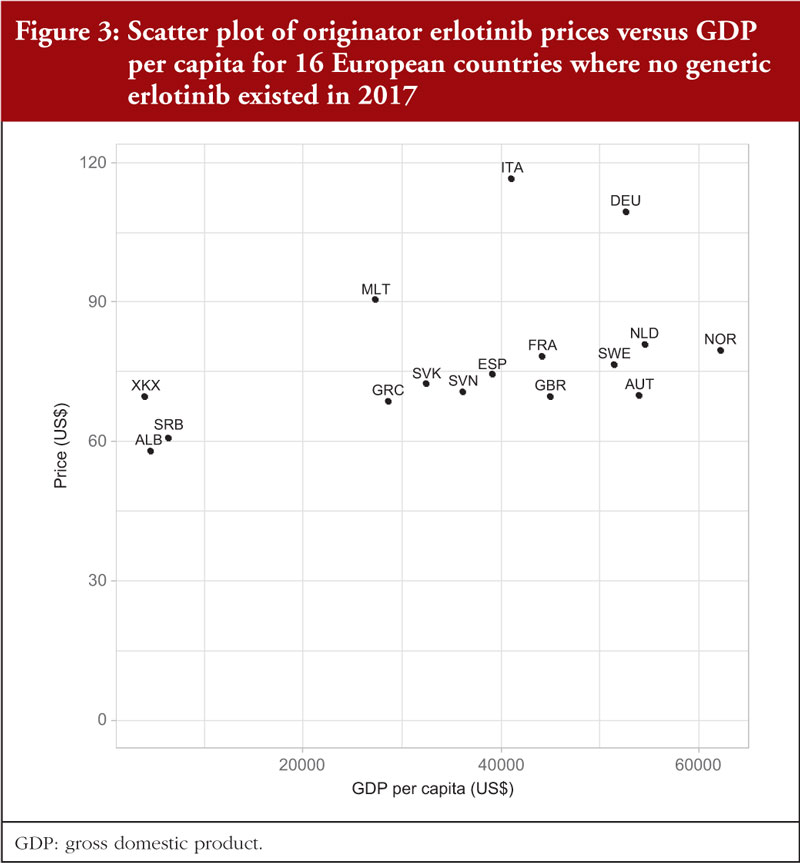
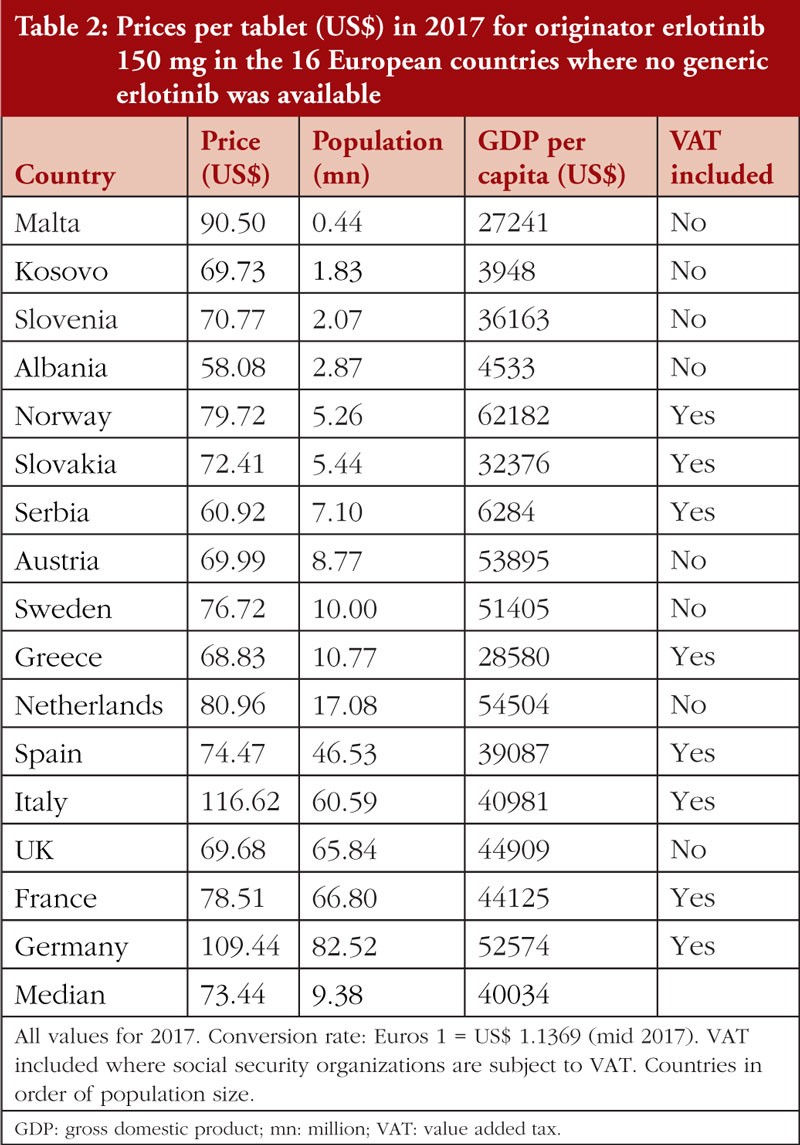
In 2017, no generic erlotinib (150 mg) was available in the selected Western European countries or in a number of the studied CEE countries [34]. Consequently, it was possible to survey prices of this on-patent product in 16 European countries. Prices varied from 20.9% below the median price (US$73.44) to 23.2% above the median (disregarding the outliers Germany and Italy at 49.0% and 58.8%, respectively), see Table 2; Figure 1. There was no significant correlation (r = 0.303; p = 0.253) between the prices of erlotinib and country’s population size, see Figure 2A in the Appendix, but there was a significant moderate positive correlation (r = 0.532; p = 0.036) between erlotinib prices and GDP per capita, see Figure 3.
There were limited differences in prices for originator erlotinib over time in these selected Western European countries, see Table 2. However, once multiple generic versions became available in 2017, prices fell rapidly in some countries. For example, in the Republic of Srpska prices fell to 26.9% of the 2013 originator prices, and in Bulgaria, Romania, and Lithuania prices fell to 34.3%, 45.7% and 54.4% of 2013 originator price, respectively. Similar trends have been observed across Europe for other oral cancer medicines once generics became available [34].
Fludarabine
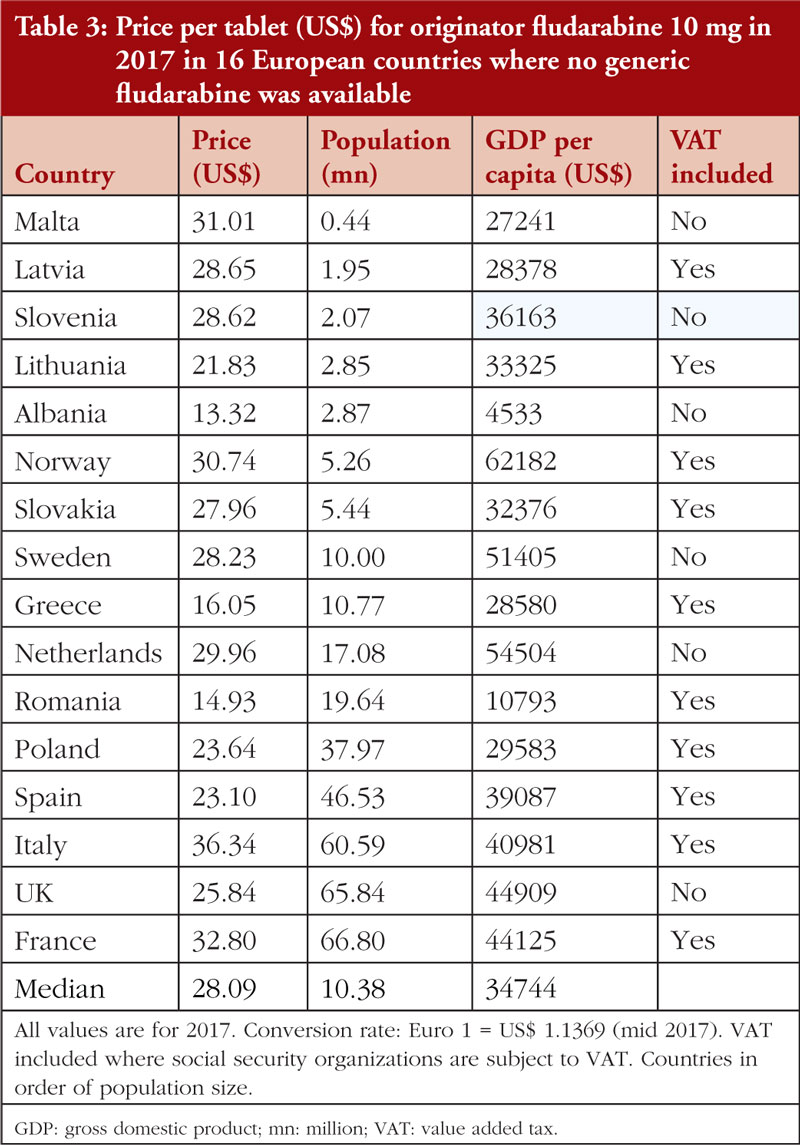
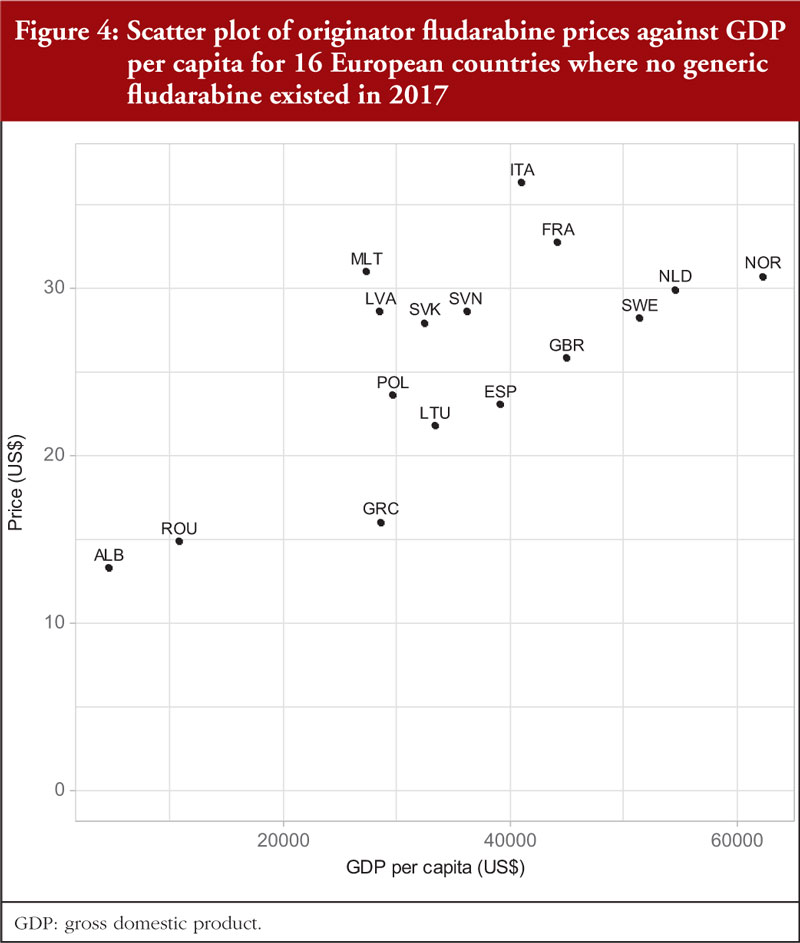
In 2017, no generic fludarabine was available in Western European countries or in a number of CEE countries. As a result, prices from 16 selected European countries were included in the analysis.
Documented prices, see Table 3 and Figure 1, ranged from 53% below to 29% above the median (US$28.09). There was no correlation (r = 0.035; p = 0.900) between the price of fludarabine and population size in these selected countries, see Figure 3A, but there was a significant moderate positive correlation (r = 0.515; p = 0.044) observed between fludarabine prices and GDP per capita, see Figure 4.
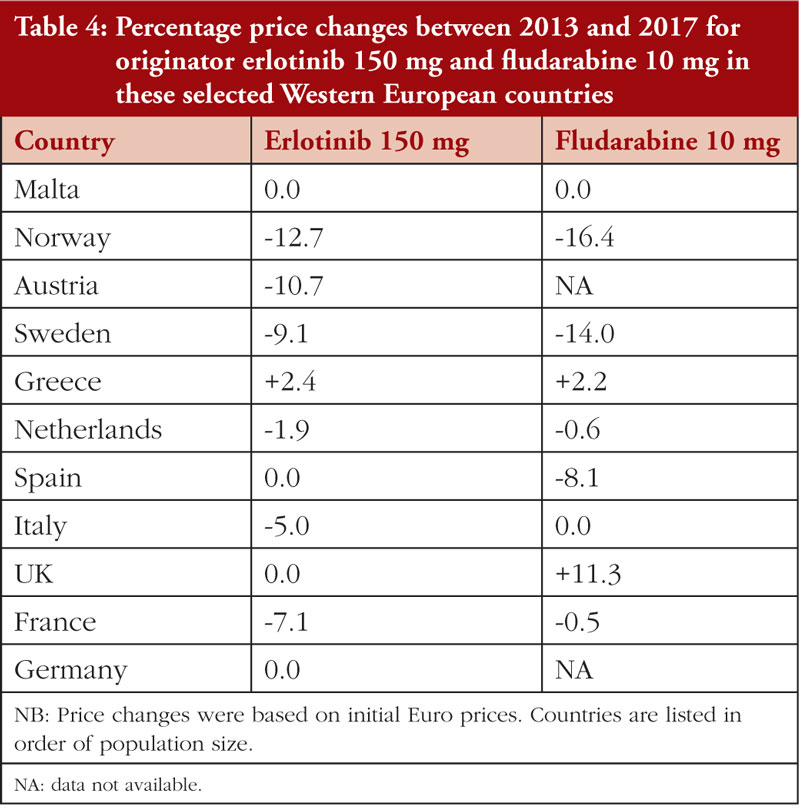
Prices for both erlotinib and fludarabine were relatively stable between 2013 and 2017 in these selected Western European countries, see Table 4.
Discussion
This study investigated reimbursed prices over time for both on-patent originator and generic oral oncology medicines across a number of European countries. Contrary to prior concerns [34, 88], but consistent with other studies [41, 89, 90], prices of the three selected oral oncology medicines were not correlated with population size. It is not clear why the price differences found in this study were greater than those reported in some prior studies [40, 41]. Consequently, further research is needed to confirm these findings and whether they reflect the impact of the recent, growing implementation of external reference pricing and of MEAs [50, 61, 63].
It is counterintuitive that the prices of patented oral cancer medicines tend to be higher in countries with greater economic power, see Figures 2 to 4. These countries should have been more able to successfully negotiate confidential discounts or rebates as part of MEAs. As a result, patients in CEE countries that use prices in countries with more economic power in pricing negotiations may be faced with higher co-payments. These issues need to be further investigated and addressed. Potential solutions include greater pricing transparency coupled with growth in pan-European purchasing consortia [91, 92].
While it has been reported that there were no differences in the pricing approaches for multisource oral oncology versus non-oncology medicines, the situation differs for new, patent protected oncology medicines. Unlike in other disease areas, new oncology medicines are granted premium prices even if they provide limited health benefits [11, 12]. It is encouraging that prices for multisource products have been reported to be similar across indications, including for indications still under patent [34]. This is unlike the situation when generic versions of pregabalin were first launched, when general practitioners in some countries were threatened with legal action if they prescribed generic pregabalin for an indication still under patent [93]. The substantial price reductions (up to 98.8%) reported across Europe following the availability of oral generic oncology medicines, see Box 1 [34], are also encouraging. However, care must be taken to ensure that lower prices for generic medicines do not lead to manufacturer created shortages or even the removal of oncology medicines from the market [94, 95]. In contrast to the situation seen previously with generic oral oncology medicines [34], limited price erosion was observed over time for on-patent oral oncology medicines in this study, see Table 4. Hopefully, in the future there will be greater re-evaluation of the prices of many other on-patent oncology medicines as more of these medicines that are used as benchmarks for pricing and reimbursement negotiations lose their patents [96, 97].
The need for more successful, continuously re-evaluated, value-based price negotiations will only increase as a result of the effects on healthcare systems from rising prices for new oncology medicines coupled with ageing populations and a concomitant increase in oncology disease prevalence. The potential impact of value-based pricing considerations is considerable, based on the level of price reductions that are now being seen for oral generic oncology medicines (e.g. up to 97.8%), biosimilars (e.g. 83% reduction in expenditure on adalimumab among Danish hospitals following biosimilars), and even originator medicines faced with the imminent launch of biosimilars (e.g. 89% price reduction in the Netherlands for Humira® just before biosimilars were launched) [33, 34, 98-100]. In addition, the impact is increasing because of ongoing measures in European countries to rapidly switch from use of originators to new biosimilars for both oncology and rheumatoid arthritis patients in a way that conserves valuable resources without compromising care [101-105].
Value-based pricing (VBP) means ‘ that countries set prices for new medicines and/or decide on reimbursement based on the therapeutic value which medicine offers, usually assessed through health technology assessment (HTA) or economic evaluation’ [30]. The use of VBP should result in major decreases in the prices for on-patent oncology medicines as more standard medicines used as benchmarks for pricing and reimbursement negotiations lose their patents. Alternatively, health authorities could seek appreciably greater discounts from companies for continued reimbursement of on-patent medicines as part of any existing MEA.
There are many limitations to this study, including the fact that in a minority of countries, procured and total prices had to be used because it was not possible to break prices down into individual components. VAT was also included for some countries when it was not possible to remove this component. Prices used may have been distorted somewhat when prices were converted to US$ based on mid-year European Central Bank exchange rates for comparison with GDP per capita. Information was also limited on whether or how often negotiating methods were evaluated or changed. Despite these limitations, it is thought that the findings are useful in providing direction to European health authorities responsible for negotiating and re-evaluating medicine prices and value.
Conclusion
This study has revealed that prices of on-patent oral cancer medicines tend to be higher in countries with greater economic power and the reasons behind this need to be understood. Lack of universal, substantial lowering of oral oncology medicine prices after the introduction of generic version is a concern because this contributes to increases in oncology medicine budgets across the region. Also of concern is the possible lack of re-assessments of the price, value, and place in treatment of patented oncology medicines following loss of patent protection of reference medicines. Monitoring the use of such proactive re-assessment will be increasingly essential given the likely future growth in global expenditure for oncology medicines being driven by rising cancer prevalence rates, coupled with the introduction of a number of expensive oncology medicines.
Competing interests: Most of the co-authors work for health authorities and health insurance companies across Europe or are advisers to them. Steven Simoens previously held the EGA Chair of the “European policy towards generic medicines”. All the authors have no other conflicts of interest to declare. The study was self-funded.
Provenance and peer review: Not commissioned; externally peer reviewed.
Authors
Brian Godman1,2,3, BSc, PhD
Steven Simoens4, MSc, PhD
Amanj Kurdi1,5, BSc, PhD
Gisbert Selke6
John Yfantopoulos7, PhD
Andrew Hill8, PhD
Jolanta Gulbinovi9, MD, PhD
Antony P Martin10,11, MA, PhD
Angela Timoney1,12, BPharm, PhD
Dzintars Gotham13, MBBS
Janet Wale14, PhD
Tomasz Bochenek15, PhD
Iva Selke Krulichová16, MSc, PhD
Eleonora Allocati17, MSc
Iris Hoxha18
Admir Malaj19
Christian Hierländer20
Anna Nachtnebel20, MSc, MD
Wouter Hamelinck21, MSc
Zornitza Mitkova22, PhD
Guenka Petrova22, PhD
Ott Laius23, PhD
Catherine Sermet24, MD, PhD
Irene Langner6
Roberta Joppi25, PhD
Arianit Jakupi26
Elita Poplavska27, PhD
Ieva Greiciute-Kuprijanov28
Patricia Vella Bonanno1, PhD
JF (Hans) Piepenbrink29
Vincent de Valk29
Robert Plisko30
Magdalene Wladysiuk30, MD, PhD
Vanda Markovi31, PhD
Ileana Mardare32, PhD
Tanja Novakovic33
Mark Parker33
Jurij Fürst34
Dominik Tomek35, PharmD, MSc, PhD
Katarina Banasova36
Mercè Obach Cortadellas37
Corrine Zara37
Caridad Pontes37,38
Maria Juhasz-Haverinen39, MScPharm
Peter Skiold40, BSc
Stuart McTaggart41
Durhane Wong-Rieger42
Stephen Campbell43,44, PhD
Ruaraidh Hill45, PhD
1Strathclyde Institute of Pharmacy and Biomedical Sciences, University of Strathclyde, 161 Cathedral Street, Glasgow G4 0RE, UK
2Division of Clinical Pharmacology, Karolinska Institute, Karolinska University Hospital Huddinge, SE-14186 Stockholm, Sweden
3School of Pharmacy, Sefako Makgatho Health Sciences University, Pretoria, Gauteng, South Africa
4KU Leuven, Department of Pharmaceutical and Pharmacological Sciences, Leuven, Belgium
5Department of Pharmacology, College of Pharmacy, Hawler Medical University, Erbil, Iraq
6Wissenschaftliches Institut der AOK (WIdO), 31 Rosenthaler Straße, DE-10178 Berlin, Germany
7School of Economics and Political Science, University of Athens, 6 Pandoras Street, Ekali, GR-14578 Athens, Greece
8Institute of Translational Medicine, University of Liverpool, UK
9Department of Pathology, Forensic Medicine and Pharmacology, Institute of Biomedical Sciences, Faculty of Medicine, Vilnius University, Suduvos g. 4-4, LT-14259 Vilnius, Lithuania
10Wolfson Centre for Personalised Medicine, University of Liverpool, Liverpool, UK
11HCD Economics, The Innovation Centre, Keckwick Ln, Daresbury, Warrington WA4 4FS, UK
12NHS Lothian Chair Scottish Intercollegiate Guidelines Network (SIGN), 2-4 Waterloo Place, Waverleygate EH1 3EG, Edinburgh, UK
13Independent researcher, London, UK
14Independent consumer advocate, 11a Lydia Street, Brunswick, Victoria 3056, Australia
15Department of Drug Management, Faculty of Health Sciences, Jagiellonian University Medical College, PL-31531 Krakow, Poland
16Department of Medical Biophysics, Faculty of Medicine in Hradec Králové, Charles University, 870 Simkova, CZ-50003 Hradec Králové, Czech Republic
17Istituto di Ricerche Farmacologiche ‘Mario Negri’ IRCCS, 2 Via Mario Negri, IT-20156 Milan, Italy
18Department of Pharmacy, Faculty of Medicine, University of Medicine, 28 Rr Isa Boletini, AL-1001 Tirana, Albania
19University of Medicine, 28 Rr Isa Boletini, AL-1001 Tirana, Albania20Dachverband der österreichischen Sozialversicherungen, 21 Kundmanngasse, AT-1030 Vienna, Austria
21Statistics Department, APB, 11 Rue Archimède, BE-1000 Brussels, Belgium
22Faculty of Pharmacy, Department of Social Pharmacy and Pharmacoeconomics, Medical University of Sofia, 2 Dunav Strasse, BG-1000 Sofia, Bulgaria
23State Agency of Medicines, 1 Nooruse, EE-50411 Tartu, Estonia
24IRDES, 117 bis rue Manin, FR-75019 Paris, France
25Pharmaceutical Drug Department, Azienda Sanitaria Locale di Verona, Azienda ULSS 9 Scaligera, 7 Via S D’Acquisto, IT-37122 Verona, Italy
26UBT – Higher Education Institut, A2 – Pharmaceutical Consulting, Nr 19, H18 Nurije Zeka, Mother Teresa Boulevard, 10000 Prishtina, Kosovo
27Medicines Marketing Authorisation Department, State Agency of Medicine, Riga, Latvia
28Department of Pharmacy, Ministry of Health of the Republic of Lithuania, 33 Vilniaus Gatve, LT-01506 Vilnius, Lithuania
29National Health Care Institute (ZIN), 4 Eekholt, NL-1112 XH Diemen, The Netherlands
30HTA Consulting, 17/3 Starowiślna Str, PL-31038 Cracow, Poland
31University of Banja Luka, Faculty of Medicine, Department of Social Pharmacy, 14 Save Mrkalja, Banja Luka, Republic of Srpska, Bosnia and Herzegovina
32Faculty of Medicine, Public Health and Management Department, “Carol Davila” University of Medicine and Pharmacy Bucharest, Room 224, et 2, 1-3 Dr Leonte Anastasievici Street, RO-050463 Bucharest, Romania
33ZEM Solutions, 9 Mosorska, RS-11000 Belgrade,
34Health Insurance Institute, 24 Miklosiceva, SI-1507 Ljubljana, Slovenia
35Faculty of Medicine, Slovak Medical University in Bratislava, 33 Gercenova, SL-85101 Bratislava, Slovakia
36Slovak Society for Pharmacoeconomics, 12 Budovatelska, SL-82108 Bratislava, Slovakia
37Drug Area, Catalan Health Service, 131 Travessera de les Corts, Edifici Olimpia, ES-08028 Barcelona, Spain
38Department of Pharmacology, Therapeutics and Toxicology, Universitat Autònoma de Barcelona, Plaça Cívica, Bellaterra, ES-08193 Barcelona, Spain
39Stockholm County Council, Health Care Management, Region Stockholm, 98 Lindhagensgatan, Box 6909, SE-10239 Stockholm, Sweden
40TLV (Dental and Pharmaceutical Benefits Agency), 18 Fleminggatan, SE-10422 Stockholm, Sweden.
41NHS National Services Scotland, Gyle Square, 1 South Gyle Crescent, Edinburgh, UK
42Canadian Organization for Rare Disorders, Suite 600, 151 Bloor Street West, Toronto, Ontario M5S 1S4, Canada
43Centre for Primary Care, Division of Population Health, Health Services Research and Primary Care, University of Manchester, Manchester M13 9PL, UK
44NIHR Greater Manchester Patient Safety Translational Research Centre, School of Health Sciences, University of Manchester, Manchester, UK
45Evidence Synthesis, Health Services Research, University of Liverpool, Liverpool, UK
References
1. OECD. Health at a Glance 2017 [homepage on the Internet]. [cited 2021 Jan 21]. Available from: https://www.oecd-ilibrary.org/social-issues-migration-health/health-at-a-glance-2017_health_glance-2017-en
2. Luzzatto L, Hyry HI, Schieppati A, Costa E, Simoens S, Schaefer F, et al. Outrageous prices of orphan drugs: a call for collaboration. Lancet. 2018;392(10149):791-4.
3. Prasad V, De Jesus K, Mailankody S. The high price of anticancer drugs: origins, implications, barriers, solutions. Nat Rev Clin Oncol. 2017;14(6):381-90.
4. Gyawali B, Sullivan R. Economics of cancer medicines: for whose benefit? New Bioeth. 2017;23(1):95-104.
5. Kelly RJ, Smith TJ. Delivering maximum clinical benefit at an affordable price: engaging stakeholders in cancer care. Lancet Oncol. 2014;15(3):e112-8.
6. Howard DH, Bach P, Berndt ER, Conti RM. Pricing in the market for anticancer drugs. J Econ Perspect. 2015;29(1):139-62.
7. Prasad V, Wang R, Afifi SH, Mailankody S. The rising price of cancer drugs – a new old problem? JAMA Oncol. 2017;3(2):277-8.
8. Memorial Sloan Kettering Cancer Centre. Price & value of cancer drug [homepage on the Internet]. [cited 2021 Jan 21]. Available from: https://www.mskcc.org/research-programs/health-policy-outcomes/cost-drugs
9. Bach PB, Saltz LB. Raising the dose and raising the cost: the case of pembrolizumab in lung cancer. J Natl Cancer Inst. 2017;109(11).
10. IMS Institute for Healthcare Informatics. Global oncology trend report. A review of 2015 and outlook to 2020. June 2016 [homepage on the Internet]. [cited 2021 Jan 21]. Available from: https://www.scribd.com/document/323179495/IMSH-Institute-Global-Oncology-Trend-2015-2020-Report
11. Godman B, Bucsics A, Vella Bonanno P, Oortwijn W, Rothe CC, Ferrario A, et al. Barriers for access to new medicines: searching for the balance between rising costs and limited budgets. Front Public Health. 2018;6:328.
12. Haycox A. Why cancer? PharmacoEconomics. 2016;34(7):625-7.
13. Godman B, Wild C, Haycox A. Patent expiry and costs for anti-cancer medicines for clinical use. Generics and Biosimilars Initiative Journal (GaBI Journal). 2017;6(3):105-6. doi: 10.5639/gabij.2017.0603.021
14. Simoens S, van Harten W, Lopes G, Vulto A, Meier K, Wilking N. What happens when the cost of cancer care becomes unsustainable. Eur Oncol Haemat. 2017;13(2):108-13.
15. Wilking N, Lopes G, Meier K, Simoens S, van Harten W, Vulto A. Can we continue to afford access to cancer treatment? Eur Oncol Haemat. 2017;13(2):114-9.
16. Waters R, Urquhart L. EvaluatePharma® World Preview 2019, Outlook to 2024. 2019.
17. Ghinea H, Kerridge I, Lipworth W. If we don’t talk about value, cancer drugs will become terminal for health systems. 2015.
18. European Commission. Communication from the commission to the European parliament, the council, the European economic and social committee and the committee of the regions. Pharmaceutical Strategy for Europe – {SWD(2020) 286 final}. November 2020 [homepage on the Internet]. [cited 2021 Jan 21]. Available from: https://eur-lex.europa.eu/legal-content/EN/TXT/PDF/?uri=CELEX:52020DC0761&from=EN
19. Bentley C, Costa S, Burgess MM, Regier D, McTaggart-Cowan H, Peacock SJ. Trade-offs, fairness, and funding for cancer drugs: key findings from a deliberative public engagement event in British Columbia, Canada. BMC Health Serv Res. 2018;18(1):339.
20. Wild C, Grossmann N, Bonanno PV, Bucsics A, Furst J, Garuoliene K, et al. Utilisation of the ESMO-MCBS in practice of HTA. Ann Oncol. 2016;27(11):2134-6.
21. World Health Organization. Access to new medicines in Europe: technical review of policy initiatives and opportunities for collaboration and research. 2015 [homepage on the Internet]. [cited 2021 Jan 21]. Available from: http://www.euro.who.int/__data/assets/pdf_file/0008/306179/Access-new-medicines-TR-PIO-collaboration-research.pdf?ua=1
22. World Health Organization. Pricing of cancer medicines and its impacts. 2018 [homepage on the Internet]. [cited 2021 Jan 21]. Available from: https://apps.who.int/iris/bitstream/handle/10665/277190/9789241515115-eng.pdf?sequence=1&isAllowed=y
23. Grössmann N, Del Paggio JC, Wolf S, Sullivan R, Booth CM, Rosian K, et al. Five years of EMA-approved systemic cancer therapies for solid tumours-a comparison of two thresholds for meaningful clinical benefit. Eur J Cancer. 2017;82:66-71.
24. Cohen D. Cancer drugs: high price, uncertain value. BMJ. 2017;359:j4543.
25. Suleman F, Low M, Moon S, Morgan SG. New business models for research and development with affordability requirements are needed to achieve fair pricing of medicines. BMJ. 2020;368:l4408-l.
26. AIM. Aim proposes to establish a European drug pricing model for fair and transparent prices for accessible pharmaceutical innovations. 2019 [homepage on the Internet]. [cited 2021 Jan 21]. Available from: https://www.aim-mutual.org/wp-content/uploads/2019/12/AIMs-proposal-for-fair-and-transparent-prices-for-pharmaceuticals.pdf
27. Uyl-de Groot CA, Löwenberg B. Sustainability and affordability of cancer drugs: a novel pricing model. Nat Rev Clin Oncol. 2018;15(7):405-6.
28. Hsu JC, Lin J-Y, Lin P-C, Lee Y-C. Comprehensive value assessment of drugs using a multi-criteria decision analysis: an example of targeted therapies for metastatic colorectal cancer treatment. PloS One. 2019;14(12):e0225938-e
29. Wilking N, Bucsics A, Kandolf Sekulovic L, Kobelt G, Laslop A, Makaroff L, et al. Achieving equal and timely access to innovative anticancer drugs in the European Union (EU): summary of a multidisciplinary CECOG-driven roundtable discussion with a focus on Eastern and South-Eastern EU countries. ESMO Open. 2019;4(6):e000550-e
30. Vogler S. Fair prices for medicines? Exploring competent authorities’ and public payers’ preferences on pharmaceutical policies. Empirica. 2019;46(3):443-69.
31. Moon S, Mariat S, Kamae I, Pedersen HB. Defining the concept of fair pricing for medicines. BMJ. 2020;368:l4726.
32. World Health Organization. WHO guideline on country pharmaceutical pricing policies, second edition. 2020 [homepage on the Internet]. [cited 2021 Jan 21]. Available from: https://apps.who.int/iris/bitstream/handle/10665/335692/9789240011878-eng.pdf
33. Sagonowsky E. AbbVie’s massive Humira discounts are stifling Netherlands biosimilars: report. 2019. Fierce Pharma. 2019 Apr 2.
34. Godman B, Hill A, Simoens S, Kurdi A, Gulbinovi J, Martin AP et al. Pricing of oral generic cancer medicines in 25 European countries; findings and implications. Generics and Biosimilars Initiative Journal (GaBI Journal). 2019;8(2):49-70. doi:10.5639/gabij.2019.0802.007
35. Hill A, Redd C, Gotham D, Erbacher I, Meldrum J, Harada R. Estimated generic prices of cancer medicines deemed cost-ineffective in England: a cost estimation analysis. BMJ Open. 2017;7(1):e011965.
36. Tefferi A, Kantarjian H, Rajkumar SV, Baker LH, Abkowitz JL, Adamson JW, et al. In support of a patient-driven initiative and petition to lower the high price of cancer drugs. Mayo Clin Proc. 2015;90(8):996-1000.
37. DeMartino PC, Miljkovic MD, Prasad V. Potential cost implications for all US Food and Drug Administration oncology drug approvals in 2018. JAMA Intern Med. 2020;e205921.
38. Vogler S, Schneider P, Zimmermann N. Evolution of average European medicine prices: implications for the methodology of external price referencing. Pharmacoecon Open. 2019;3(3):303-9.
39. Emanuel EJ, Zhang C, Glickman A, Gudbranson E, DiMagno SSP, Urwin JW. Drug reimbursement regulation in 6 peer countries. JAMA Intern Med. 2020. doi:10.1001/jamainternmed.2020.4793.
40. Vogler S, Zimmermann N, Babar ZU. Price comparison of high-cost originator medicines in European countries. Expert Rev Pharmacoecon Outcomes Res. 2017;17(2):221-30.
41. Vokinger KN, Hwang TJ, Grischott T, Reichert S, Tibau A, Rosemann T, et al. Prices and clinical benefit of cancer drugs in the USA and Europe: a cost–benefit analysis. Lancet Oncol. 2020;21(5):664-70.
42. Leopold C, Vogler S, Mantel-Teeuwisse AK, de Joncheere K, Leufkens HGM, Laing R. Differences in external price referencing in Europe: a descriptive overview. Health Policy. 2012;104(1):50-60.
43. Eatwell E, Swierczyna A. Emerging voluntary cooperation between European healthcare systems: are we facing a new future? Medicine Access@Point of Care. 2019;1-8.
44. O’Mahony JF. Beneluxa: what are the prospects for collective bargaining on pharmaceutical prices given diverse health technology assessment processes? Pharmacoeconomics. 2019;37(5):627-30.
45. European Commission. Defining value in “value based healthcare”. Report of the Expert Panel on effective ways of investing in Health (EXPH). 2019 [homepage on the Internet]. [cited 2021 Jan 21]. Available from: https://ec.europa.eu/health/sites/health/files/expert_panel/docs/024_defining-value-vbhc_en.pdf
46. Godman B, Wettermark B, van Woerkom M, Fraeyman J, Alvarez-Madrazo S, Berg C, et al. Multiple policies to enhance prescribing efficiency for established medicines in Europe with a particular focus on demand-side measures: findings and future implications. Front Pharmacol. 2014;5:106.
47. Moorkens E, Vulto AG, Huys I, Dylst P, Godman B, Keuerleber S, et al. Policies for biosimilar uptake in Europe: an overview. PloS One. 2017;12(12):e0190147.
48. Godman B, Malmström RE, Diogene E, Jayathissa S, McTaggart S, Cars T, et al. Dabigatran – a continuing exemplar case history demonstrating the need for comprehensive models to optimize the utilization of new drugs. Front Pharmacol. 2014;5:109.
49. Vogler S. The impact of pharmaceutical pricing and reimbursement policies on generics uptake: implementation of policy options on generics in 29 European countries–an overview. Generics and Biosimilar Journal (GaBI Journal). 2012;1(2):93-100. doi:10.5639/gabij.2012.0102.020
50. Ferrario A, Arāa D, Bochenek T, Ĉatić T, Dankó D, Dimitrova M, et al. The implementation of managed entry agreements in Central and Eastern Europe: findings and implications. Pharmacoeconomics. 2017;35(12):1271-85.
51. Vella Bonanno P, Bucsics A, Simoens S, Martin AP, Oortwijn W, Gulbinovic J, et al. Proposal for a regulation on health technology assessment in Europe – opinions of policy makers, payers and academics from the field of HTA. Expert Rev Pharmacoecon Outcomes Res. 2019;19(3):251-61.
52. Godman B, Shrank W, Andersen M, Berg C, Bishop I, Burkhardt T, et al. Policies to enhance prescribing efficiency in Europe: findings and future implications. Front Pharmacol. 2010;1:141.
53. Moon JC, Godman B, Petzold M, Alvarez-Madrazo S, Bennett K, Bishop I, et al. Different initiatives across Europe to enhance losartan utilization post generics: impact and implications. Front Pharmacol. 2014;5:219.
54. Vonĉna L, Strizrep T, Godman B, Bennie M, Bishop I, Campbell S, et al. Influence of demand-side measures to enhance renin-angiotensin prescribing efficiency in Europe: implications for the future. Expert Rev Pharmacoecon Outcomes Res. 2011;11(4):469-79.
55. Vogler S, Schneider P. Assessing data sources for medicine price studies. Int J Technol Assess Health Care. 2019;35(2):106-15.
56. Godman B, Petzold M, Bennett K, Bennie M, Bucsics A, Finlayson AE, et al. Can authorities appreciably enhance the prescribing of oral generic risperidone to conserve resources? Findings from across Europe and their implications. BMC Med. 2014;12:98.
57. Godman B, Shrank W, Andersen M, Berg C, Bishop I, Burkhardt T, et al. Comparing policies to enhance prescribing efficiency in Europe through increasing generic utilization: changes seen and global implications. Expert Rev Pharmacoecon Outcomes Res. 2010;10(6):707-22.
58. Godman B, Bishop I, Finlayson AE, Campbell S, Kwon HY, Bennie M. Reforms and initiatives in Scotland in recent years to encourage the prescribing of generic drugs, their influence and implications for other countries. Expert Rev Pharmacoecon Outcomes Res. 2013;13(4):469-82.
59. WHO Collaborating Centre for Drug Statistics Methodology. ATC/ DDD Index. 2019 [homepage on the Internet]. [cited 2021 Jan 21]. Available from: https://www.whocc.no/
60. Adamski J, Godman B, Ofierska-Sujkowska G, Osinska B, Herholz H, Wendykowska K, et al. Risk sharing arrangements for pharmaceuticals: potential considerations and recommendations for European payers. BMC Health Serv Res. 2010;10:153.
61. Zampirolli Dias C, Godman B, Gargano LP, Azevedo PS, Garcia MM, Souza Cazarim M, et al. Integrative review of managed entry agreements: chances and limitations. Pharmacoeconomics. 2020;38(11):1165-85.
62. Pauwels K, Huys I, Vogler S, Casteels M, Simoens S. Managed entry agreements for oncology drugs: lessons from the European experience to inform the future. Front Pharmacol. 2017;8:171.
63. Darbà J, Ascanio M. The current performance-linked and risk sharing agreement scene in the Spanish region of Catalonia. Expert Rev Pharmacoecon Outcomes Res. 2019;19(6):743-8.
64. British pound to Euro spot exchange rates for 2013 from the Bank of England. Pound Sterling Live 2020.
65. British pound to Euro spot exchange rates for 2014 from the Bank of England. Pound Sterling Live 2020..
66. British pound to Euro spot exchange rates for 2015 from the Bank of England. Pound Sterling Live 2020.
67. Sveriges Riksbank. Search interest & exchange rates [homepage on the Internet]. [cited 2021 Jan 21]. Available from: https://www.riksbank.se/en-gb/statistics/search-interest–exchange-rates/?g130-SEKEURPMI=on&from=28%2F12%2F2017&to=29%2F12%2F2017&f=Day&c=cAverage&s=Comma
68. Narodowy Bank Polski. Exchange rates [homepage on the Internet]. [cited 2021 Jan 21]. Available from: http://www.nbp.pl/homen.aspx?f=/kursy/kursyen.htm
69. National Bank of Serbia. Exchange rate [homepage on the Internet]. [cited 2021 Jan 21]. Available from: https://www.nbs.rs/export/sites/default/internet/english/scripts/kl_srednji.html
70. Norges Bank. Exchange rates [homepage on the Internet]. [cited 2021 Jan 21]. Available from: https://www.norges-bank.no/en/topics/Statistics/exchange_rates/
71. Banca Naţionala a României. Exchange rates [homepage on the Internet]. [cited 2021 Jan 21]. Available from: https://www.bnr.ro/Exchange-Rates–3727.aspx
72. OECD Stat. Level of GDP per capita and productivity [homepage on the Internet]. [cited 2021 Jan 21]. Available from: https://stats.oecd.org/Index.aspx?DataSetCode=PDB_LV
73. European Central Bank. Euro foreign exchange reference rates. 1 July 2015 [homepage on the Internet]. [cited 2021 Jan 21]. Available from: https://www.ecb.europa.eu/stats/exchange/eurofxref/shared/pdf/2015/07/20150701.pdf
74. European Central Bank. Euro foreign exchange reference rates. 3 July 2017 [homepage on the Internet]. [cited 2021 Jan 21]. Available from: https://www.ecb.europa.eu/stats/exchange/eurofxref/shared/pdf/2017/07/20170703.pdf
75. Institute of Statistics. Population of Albania, 1 January 2017 [homepage on the Internet]. [cited 2021 Jan 21]. Available from: http://www.instat.gov.al/en/themes/demography-and-social-indicators/population/publication/2017/population-of-albania-1-januar-2017/
76. World Population Data. Malta [homepage on the Internet]. [cited 2021 Jan 21]. Available from: http://worldpopulationreview.com/countries/malta-population/
77. OECD Stat. Population data [homepage on the Internet]. [cited 2021 Jan 21]. Available from: https://stats.oecd.org/Index.aspx?DataSetCode=EDU_DEM
78. Republic of Cyprus demographic report, 2017 [homepage on the Internet]. [cited 2021 Jan 21]. Available from: https://www.mof.gov.cy/mof/cystat/statistics.nsf/All/6C25304C1E70C304C2257833003432B3/$file/demographic_report-2017-301118.pdf?OpenElement
79. Zamfir R. Romania is losing its people! Over 0.6 percent of the population vanished in just one year. Business Review. 2018 Aug 29.
80. Statistical Office of the Republic of Serbia. Estimates of population of the Republic of Serbia by sex, age and type of settlement 2013-2017. 2019 [homepage on the Internet]. [cited 2021 Jan 21]. Available from:http://publikacije.stat.gov.rs/G2018/PdfE/G201815012.pdf
81. The World Bank. Kosovo. 2019 [homepage on the Internet]. [cited 2021 Jan 21]. Available from: https://data.worldbank.org/country/kosovo
82. International Organization for Standardization (ISO). ISO 3166 Country Codes Alpha-3. 2013 [homepage on the Internet]. [cited 2021 Jan 21]. Available from: https://www.iso.org/obp/ui
83. R Core Team. R: A language and environment for statistical computing. R Foundation for Statistical Computing, Vienna, Austria. 2019 [homepage on the Internet]. [cited 2021 Jan 21]. Available from: https://www.R-project.org/
84. Godman B, Kurdi A, McCabe H, Johnson CF, Barbui C, MacBride-Stewart S, et al. Ongoing initiatives within the Scottish National Health Service to affect the prescribing of selective serotonin reuptake inhibitors and their influence. J Comp Eff Res. 2019;8(7):535-47.
85. Simoens S. A review of generic medicine pricing in Europe. Generics and Biosimilar Journal (GaBI Journal). 2012;1(1):8-12. doi:10.5639/gabij.2012.0101.004
86. Godman B, Wettermark B, Bishop I, Burkhardt T, Fürst J, Garuoliene K, et al. European payer initiatives to reduce prescribing costs through use of generics. Generics and Biosimilars Initiative Journal (GaBI Journal). 2012;1(1):22-7. doi:10.5639/gabij.2012.0101.007
87. Godman B, Acurcio F, Guerra Junior AA, Alvarez-Madrazo S, Faridah Aryani MY, et al. Initiatives among authorities to improve the quality and efficiency of prescribing and the implications. J Pharma Care Health Sys. 2014;1(3):1-15.
88. McKee M, Stuckler D, Martin-Moreno JM. Protecting health in hard times. BMJ. 2010;341:c5308.
89. Markovic-Pekovic V, Skrbic R, Godman B, Gustafsson LL. Ongoing initiatives in the Republic of Srpska to enhance prescribing efficiency: influence and future directions. Expert Rev Pharmacoecon Outcomes Res. 2012;12(5):661-71.
90. Garuoliene K, Godman B, Gulbinovi J, Wettermark B, Haycox A. European countries with small populations can obtain low prices for drugs: Lithuania as a case history. Expert Rev Pharmacoecon Outcomes Res. 2011;11(3):343-9
91. Office of the Deputy Prime Minister and the Ministry for Health of Malta. Valletta Technical Group continues to grow. 2018 [homepage on the Internet]. [cited 2021 Jan 21]. Available from: http://www.livenewsmalta.com/index.php/2018/01/31/valletta-technical-group-continues-to-grow/
92. O’Mahony JF. Beneluxa: what are the prospects for collective bargaining on pharmaceutical prices given diverse health technology assessment processes? Pharmacoeconomics. 2019;37(5):627-30.
93. Godman B, Wilcock M, Martin A, Bryson S, Baumgärtel C, Bochenek T, et al. Generic pregabalin; current situation and implications for health authorities, generics and biosimilars manufacturers in the future. Generics and Biosimilars Initiative Journal (GaBI Journal). 2015;4(3):125-35. doi:10.5639/gabij.2015.0403.028
94. Dylst P, Vulto A, Godman B, Simoens S. Generic medicines: solutions for a sustainable drug market? Appl Health Econ Health Policy. 2013;11(5):437-43.
95. Bochenek T, Abilova V, Alkan A, Asanin B, de Miguel Beriain I, Besovic Z, et al. Systemic measures and legislative and organizational frameworks aimed at preventing or mitigating drug shortages in 28 European and Western Asian Countries. Front Pharmacol. 2017;8:942.
96. Huang HY, Wu DW, Ma F, Liu ZL, Shi JF, Chen X, et al. Availability of anticancer biosimilars in 40 countries. Lancet Oncol. 2020;21(2):197-201.
97. Derbyshire M, Shina S. Patent expiry dates for biologicals: 2017 update. Generics and Biosimilars Initiative Journal (GaBI Journal). 2018;7(1):29-34. doi: 10.5639/gabij.2019.0801.003
98. Godman B, Allocati E, Moorkens E. Ever-changing landscape of biosimilars in Canada; findings and implications from a global perspective. Generics and Biosimilars Initiatives Journal (GaBI Journal). 2019;8(3):93-7. doi:10.5639/gabij.2019.0803.012
99. Hollis A. Sustainable financing of innovative therapies: a review of approaches. Pharmacoeconomics. 2016;34(10):971-80.
100. Jensen TB, Kim SC, Jimenez-Solem E, Bartels D, Christensen HR, Andersen JT. Shift from adalimumab originator to biosimilars in Denmark. JAMA Intern Med. 2020;180(6):902-3.
101. Godman B. Biosimilars are becoming indispensable in the management of multiple diseases although concerns still exist. Bangladesh Journal of Medical Science. 2021;20(1):5-10
102. Godman B, Allocati E, Moorkens E, Kwon H-Y. Can local policies on biosimilars optimize the use of freed resources – experiences from Italy. Generics and Biosimilars Initiative Journal (GaBI Journal). 2020;9(4):183-7. doi:10.5639/gabij.2020.0904.029
103. Moorkens M, Godman B, Huys I, Hoxha I, Malaj A, Keuerleber S, et al. The expiry of Humira® market exclusivity and the entry of adalimumab biosimilars in Europe: an overview of pricing and national policy measures. Front Pharmacol. 2021;11:591134.
104. NHS Scotland. Secondary care national therapeutic indicators 2019/20. 2019 [homepage on the Internet]. [cited 2021 Jan 21]. Available from:https://www.therapeutics.scot.nhs.uk/wp-content/uploads/2020/10/Secondary-care-NTIs-2019-20-final.pdf.
105. Lee SM, Jung JH, Suh D, Jung YS, Yoo SL, Kim DW, et al. Budget impact of switching to biosimilar trastuzumab (CT-P6) for the treatment of breast cancer and gastric cancer in 28 European countries. BioDrugs. 2019;33(4):423-36.
|
Author for correspondence: Brian Godman, BSc, PhD, Strathclyde Institute of Pharmacy and Biomedical Sciences, University of Strathclyde, 161 Cathedral Street, Glasgow G4 0RE, UK |
Disclosure of Conflict of Interest Statement is available upon request.
Copyright © 2021 Pro Pharma Communications International
Permission granted to reproduce for personal and non-commercial use only. All other reproduction, copy or reprinting of all or part of any ‘Content’ found on this website is strictly prohibited without the prior consent of the publisher. Contact the publisher to obtain permission before redistributing.