Biosimilars in the European market
Published on 2012/10/11
Generics and Biosimilars Initiative Journal (GaBI Journal). 2013;2(1):30-5.
Author byline as per print journal: Professor Joan Rovira, PhD; Leandro Lindner, BSc; Emmanuel Giménez, BSc; Professor Jaime Espín, PhD; Antonio Olry de Labry, PhD; Leticia García, BSc
|
Introduction and study objectives: To describe the development of biosimilars in 24 European Union (EU) Member States, plus Norway and Switzerland, and to identify the key parameters associated with biosimilars market dynamics across EU Member States. |
Submitted: 20 September 2012; Revised: 11 February 2013; Accepted: 11 March 2013; Published online first: 18 March 2013
Introduction and study objectives
Biopharmaceutical medicines (‘biologicals’) are medicinal products made by or derived from living organisms using biotechnology, i.e. rDNA, controlled gene expression or antibody technologies [1, 2]. These medicines, manufactured from a unique line of living cells, tend to have a complex molecular structure that makes it impossible to ensure an identical copy. This contrast with chemical medicines, with molecules that tend to be small in size, have a simple structure and can be manufactured by predictable chemical processes that generate identical copies [3]. Biologicals constitute a fast-growing segment of the pharmaceutical market. In 2000, only one out of the 10 drugs with the largest worldwide sales was a biological product, whereas in 2008 half of these worldwide bestsellers were biological [4]. Biological medicines have made substantial contributions to improving the effectiveness of therapies in many disease areas and they are expected to continue doing so in the future [5]. But these benefits come with increasing higher treatment costs, which threaten accessibility and the financial sustainability of health systems. Biological sales in 2010 account for about US$134 billion in Australia, Canada, EU and Japan [4].
The term ‘biosimilars’ has been used by the European Medicines Agency to describe officially approved subsequent versions of innovator biological products made by a different manufacturer after the patent and exclusivity rights have expired [6]. The expiration of patents and other intellectual property rights of biological innovators opened the opportunity for biosimilars to enter the market and increase competition among producers of biologicals. However, the characteristics of biological medicines, particularly the nature of their production process and the need to guarantee patient safety, require a more comprehensive and lengthier development process for authorizing biosimilars than is the case for conventional generics.
While generic versions of small-size molecule medicines are only required to undergo relatively small and inexpensive bioequivalence trials to obtain market authorization and be considered therapeutically equivalent to the reference medicine (and hence substitutable), the situation is very different for biosimilars. Obtaining marketing authorization for biosimilars requires a large and costly process of clinical development and does not automatically ensure substitutability with the reference product [7]. Therefore, the market dynamic of biological medicines is likely to diverge greatly from that of conventional small-molecule medicines. The reduction in prices due to competition and the degree of competitors’ penetration is, and probably will be in the future, much lower, leading over the long term to smaller relative price reductions than those seen in the conventional generics market. Still, in absolute terms, given the high prices of biological medicines, even small relative price reductions might lead to substantial savings [8].
In the EU the first patents on biopharmaceuticals expired in 2001, and the first biosimilar medicines or follow-on biologicals were approved by EMA in April 2006 and launched in May 2007. To date, biosimilars of only three biological medicines have entered the European market: recombinant human erythropoietins (epoetin alpha and epoetin zeta), G-CSFs (filgrastim), and human growth hormones (somatropin). In the coming years, patents will expire on some major biopharmaceuticals such as interferons and insulins. This is likely to lead to the market entry of a large number of biosimilars in the not too distant future.
The aim of this study is to describe the development of the biosimilars’ market in 24 EU Member States, plus Norway and Switzerland, and to identify the key parameters of EU biosimilars’ market dynamics across countries: time to market entry of competitors, price differentials between countries and evolution of prices and market shares.
Methods
Data collection
A quantitative analysis of the EU biosimilars’ market from 2007 to 2010 was conducted for 26 EU Member States considering the following variables: date of market entry, unit sales and prices (estimated using official prices) of existing biosimilars and their respective reference products.
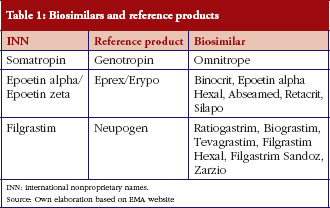
Reference products and associated biosimilars’ market authorization information (approval dates) were obtained from the EMA web page [9]. All biosimilars that had been authorized by 2010 and their respective reference products were considered. Three biological products had been reference products for at least one biosimilar authorized by the EC. Their names, and their respective biosimilar and reference (originator) product names are presented in Table 1.
Drug-consumption data at the patient level are generally not publicly available in most EU countries. This study used the IMS Multinational Integrated Data Analysis System (MIDAS) database, which is a commercial database that contains retail and hospital drug-utilization data from a large number of countries, including practically all developed countries [10]. Values extracted from the MIDAS database were: market entry dates (defined as first detected sales), sales volumes between 2007 and 2010 (in units) and prices (official list prices) for reference products and biosimilars. Data were collected for 26 countries: Austria, Belgium, Bulgaria, Czech Republic, Denmark, Estonia, Finland, France, Germany, Greece, Hungary, Ireland, Italy, Latvia, Lithuania, The Netherlands, Norway, Poland, Portugal, Romania, Slovakia, Slovenia, Spain, Sweden, Switzerland, and UK.
In some countries, IMS collects data only from pharmacies. However, in most countries, data are collected from wholesalers’ sales to retail or hospital pharmacies and manufacturers’ sales to retail or hospital pharmacies. IMS samples a number of retail or hospital pharmacies and wholesalers and from these data makes predictions of sales for all retail and hospital pharmacies in a country. Information in the database covered the hospital and retail (pharmacy) markets of 22 countries. The remaining four countries (Estonia, Greece, Portugal and Slovakia) only had information on the retail market (this must be taken into consideration when making comparisons of market size between countries). It must also be considered that when market data (units sold and price) are missing for a given product in a country, this does not necessarily mean that the product had not been launched in the country. If the sales volume was relatively small, the product might not be detected in the database’s sample and, therefore, not reported. As a result, the entry dates used in our analysis might be later than the actual launch dates.
Analysis was undertaken on three key variables for each biosimilar: time to market entry, inter-country comparison between the prices of reference products and biosimilars, and market share.
Time to market entry analysis
The objective of this analysis is to assess the differences in availability across countries and to estimate the periods of exclusivity of the reference products in each country. In order to measure the time to market entry, information was gathered on the date of EMA approval of all biosimilars existing in at least one country by the end of 2010, the date of the corresponding reference products (Genotropin, Neupogen and Eprex) and the date of market entry in each national market of all products, see Figure 1. Market entry corresponds to the first period of time when a given product is detected in market surveys and appears on the MIDAS database. An analysis was done for 22 countries that were able to provide complete information on dates (Bulgaria, Czech Republic, Estonia and Switzerland were excluded).

Inter-country comparison of the prices of reference products and of biosimilars
The objective of this analysis was to assess price differences between reference products and biosimilars. In order to aggregate the prices of all presentations for each product, prices were expressed as price per defined daily dose (DDD), computed as a simple average of all the presentations (packs) by calculating the price per DDD. Each pack price per DDD was calculated through the formula:
The product’s DDD and the doses per pack were collected from the World Health Organization (WHO) [11]. Once the reference product’s price per DDD and the respective price for biosimilars were obtained, variability among prices was assessed by computing the ratios between the highest and lowest values among countries. Differences computed as a percentage in relation to the reference product’s price (relative discounts) were also calculated. The overall relative biosimilar/reference discount was calculated based on weighting each country discount by the quantity of reference product units sold. Analysis of the variability between the price per DDD of the biosimilar and the reference product was limited to five markets (France, Germany, Italy, Spain and UK) but the relative discount analysis was based on 26 European countries.
Market share
The purpose of this analysis was to provide an annual estimate of market size in terms of monetary values by dividing the market value of biosimilars by that of the total (biosimilars and reference products) market, based on data from 26 countries.
Impact of demographic, economic and pharmaceutical policy variables in the biosimilars market across countries
The purpose of this analysis was to investigate the relationship between previously identified parameters of the EU’s biosimilars market dynamics (market exclusivity, market share and time to market entry) and a set of demographic, economic and pharmaceutical policy variables across countries. Four dependent variables were constructed for the three market dynamics variables: one for each of the products (somatropin, epoietin and filgastrim) and one for their average. Once the twelve continuous variables were built, their corresponding and therefore final dichotomous dependent variables represented the countries over and under each variable mean.
Data from demographic, economic and pharmaceutical policy variables was obtained from public sources (EFPIA, Eurostat and WHO web pages) [12–14].
Bivariate regression analyses were conducted to identify statistical associations between: 1) time period between EMA’s approval and market entry of each of the biosimilars; 2) market share (in monetary value); 3) market exclusivity period of the reference product and the following continuous and dichotomous independent variables:
- Continuous independent variables: pharmaceutical market value, population, gross national income (GNI), price level index of medicines (expresses the price level of a given country relative to the other European countries by dividing the purchasing power parities by the current nominal exchange rate), total expenditure on health as % of GNI, total expenditure on health in absolute terms and government expenditure on health.
- Dichotomous (yes/no) independent variables: existence of generics price control, application of international price comparison, tendering-like practices, pharmacists generics substitution, international nonproprietary name prescribing, procedures for pricing and/or reimbursement decision, and the reference price system.
A preliminary multivariate regression analysis was conducted but has not been reported because it did not yield any statistically significant results.
Results
Time to market entry analysis
Taking into account the patent expiry dates of the reference products which already face competition from biosimilars (somatropin, 2003; erythropoietin, 2004; filgrastim, 2006) and the dates when the first biosimilar was marketed in the countries, it can be concluded that biosimilar competition started between two and four years after patent expiry (somatropin, 3–4 years; erythropoietin, 3–4 years; filgrastim, 2–3 years). These figures are not representative of all biologicals, as they refer to the products that by 2010 had biosimilar competitors on the market. There are, however, off-patent biologicals with no biosimilar competitors to date. Biosimilar competition might start for these products with a larger delay or it might never start, if biosimilars are never marketed for lack of expected profitability. Time to entry of biosimilars for an average originator is therefore likely to extend beyond the estimates provided in this analysis.
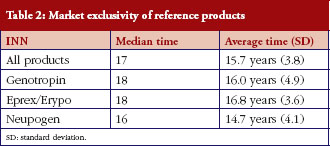
Genotropin, the first biological to face biosimilar competition in the EU, has experienced the largest exclusivity times among the three biologicals reviewed here. In some countries drugs have experienced exclusivity times as long as 21 years (Genotropin in Slovenia) and as low as six years (Neupogen in Romania). The median of the market exclusivity period of reference products was 17 years and did not differ much among the three products, whose corresponding medians ranged from 16 to 18 years, see Table 2.
Substantial differences were found in the launch dates of some of the biological reference products in certain countries. For instance, somatropin was launched in France in 1997, nine years later than in Germany and in UK (1988). In France and Germany, epoetin alpha was launched 10 and 11 years, respectively, after its launch in Spain and UK (1990). Filgrastim was launched in Germany 10 years later than in Spain and UK. The first biosimilar launch in the EU (omnitrope/somatropin) was in Germany in 2006. In contrast with the dispersion of launch times for the reference products (1988–2001), the launch of the (first) biosimilar of each product in the five major markets is concentrated in the three-year period 2007–2009.
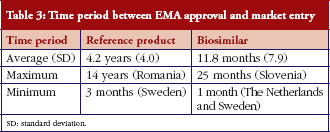
The time period between EMA approval and market entry was larger for reference products than for biosimilars, see Table 3.
Inter-country comparison of the prices of reference products and of biosimilars
Remarkable differences in biosimilar–reference product prices per DDD appeared across the five main countries in 2010.
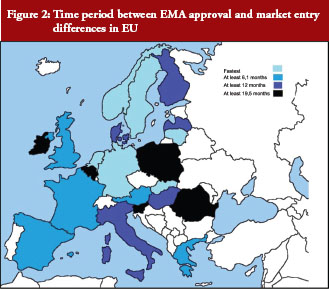
Time periods between EMA approval and market entry vary substantially across EU countries, see Figure 2.
Variation ratios between the highest and the lowest country price ranged from 1.4 to 2.7:
- Omnitrope (somatropin): Italy: Euros 10, Germany: Euros 20.8; ratio: 2.08.
- Binocrit (epoietin alpha)1: UK: Euros 3.5, Italy: Euros 9.6; ratio: 2.71.
- Retracrit (epoietin zeta): Germany: Euros 5.1, Italy: Euros 7.2; ratio: 1.39.
- Ratiogastrim (filgrastim): Spain: Euros 47.6, France: Euros 87.7; ratio: 1.84.
1Not launched in Spain as of December 2009.
On the other hand, the average discount biosimilar–reference product in all 26 countries shows the following evolution, see Table 4.
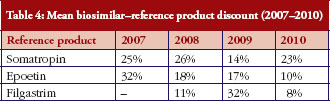
No clear pattern emerges so far from this data regarding the magnitude and evolution of the products’ prices and discounts, which can be explained by the limited experience with biosimilars to date. In the case of somatropin, the discount was in the range of 23–26% between 2007 and 2010, except in 2009, when it dropped to 14%. The discount for epoetin alpha shows a clear decline from its 32% discount in 2007, to 18% in 2008 and down to 10% in 2010. Finally, filgrastim biosimilars show the lowest discount figures in 2008 and 2010 (11% and 8% respectively), but then rise to 32% in 2009.
Market share
Biosimilar sales have gone up rapidly from Euros 3.3 million in 2007 to Euros 162.1 million in 2010.
Market share rose from 0.33% in 2007 to 15.52% in 2010. The figures for 2010 ranged from the high levels of Greece (73%), Romania (41.9%) or Austria (37.2%) to the remarkably low ones of Belgium (2%), Denmark (1.2%) and Czech Republic (1.9%), see Table 5 and Figure 3.


Impact of demographic, economic and pharmaceutical policy variables in the biosimilars market across countries
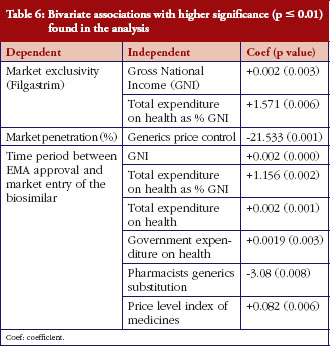
The following independent variables were associated with a faster launch of biosimilars in the countries under consideration: generics price control, GNI and expenditure on health-related variables, pharmacists’ generics substitution and price level index. The bivariate associations found with higher significance (p = 0.01) are presented in Table 6. No associations were found for the nine additional independent variables included in the analysis, which have therefore not been reported in the table.
Discussion
This study is, to our knowledge, the first published comprehensive analyses of the market dynamic of biosimilars in EU countries.
The results suggest an increase in the market share rate of biosimilars, as well as large differences between products and countries. It is important to note that the figures provided do not refer to the market for all biological medicines, but only to those for which biosimilars were available by the end of 2010.
Regarding the biosimilar–reference product price discounts, no clear patterns seem to emerge so far, probably due to the relatively short history of biosimilars. However, price discounts seem on average smaller than those usually found in the markets of small molecules. These price discount results are similar to or slightly lower than the figures provided for the US in the 2008 Congressional Budget Office report, which estimated the price discount of biosimilars in relation to the reference product at about 20–40%, with peak biosimilar penetration rates varying from 10% to 35% over four years [15].
It must be acknowledged that the official prices used in this analysis probably overstate the actual market (or transaction) prices, which include discounts, rebates and other factors that imply a reduction of the official/list price. This is a limitation found in most price analyses, but is probably even more severe in our study because most product sales occur in the hospital market, where tenders and price negotiations produce higher price reductions than in the retail market.
Finally, the period of market exclusivity of biological medicines is likely to be longer than that for small molecules, since the figures provided do not consider originators that are off-patent but still lacking biosimilars competitors.
One of the limitations of this analysis is that the accuracy of the MIDAS data varied across the countries covered, particularly in relation to the hospital market; several products had a very high proportion of their sales on the hospital market, and there was a high likelihood of overstating prices and, consequently, expenditure estimates. Other limitations should also be considered, for example, the fact that several countries might not have had data on some of the products for one or more years, either because the biosimilar had not been launched there or because the volume of sales was very small and went unreported in the sample of centres providing information to the MIDAS database. This could introduce some error in entry times, although we think that the magnitude of the error would be small, leaving the main results and conclusions unaffected. Although the MIDAS database is the most comprehensive source of information on international drug sales, IMS data is based on sample audits of the market that are often incomplete. This could underestimate the actual pharmaceutical market size.
Conclusion
Biological medicines hold the promise of new and better treatments for many diseases, although that promise is also accompanied by additional financial burdens for already over-stressed pharmaceutical and healthcare budgets. Health authorities assume that biosimilars have the potential of lowering prices and hence reducing the pressures on pharmaceutical expenditure, as happens with generics in the small molecule medicines markets. The limited existing evidence suggests, however, that the relative rates of market share uptake and impact on prices are much lower for biological medicines than for small-molecule medicines. Although it has been constantly growing since 2007, by 2010 biosimilars have only a 15% market share of the aggregate products market.
Nevertheless, national authorities might want to take advantage of the potential of biosimilars to make savings in pharmaceutical expenditure. As EMA does not provide any recommendations or guidance of biosimilar substitutions it is up to the national authorities to more actively promote them. Substitution is likely to grow when new information on the effectiveness and safety of biosimilars is collected and disseminated.
One of the findings of this study is that the uptake of biosimilars has been much quicker than that of the respective reference products.
The evolution of price differentials between biosimilars and reference products is much smaller than for price differentials found in the traditional generics markets. Moreover, price differentials for the three products analysed here do not show similar trends over time. As has already been stated, available prices of hospital medicines are not very reliable, as they are often subject to discounts, rebates and other confidential price reductions, which might distort the results of the analysis.
Acknowledgements
We thank IMS for providing the data from the MIDAS (Multinational Integrated Data Analysis System) database. We also thank Mr David Epstein for English editing of the manuscript and for useful comments on the content. Any remaining errors are the sole responsibility of the authors.
Disclaimer
This manuscript does not reflect the opinions or views of the author’s institutions or of the funding organization, but only those of the authors.
The authors report no conflicts of interest directly relevant to the content of this manuscript.
Disclosure of financial and competing interests: This manuscript is based on the report ‘The impact of biosimilars’ entry in the EU market’ by Professor Joan Rovira, Professor Jaime Espín, Leticia García, and Antonio Olry de Labry, Andalusian School of Public Health, EMINet, January, 2011. The report is funded by DG Enterprise and Industry of the European Commission. This report can be accessed at: ec.europa.eu/enterprise/sectors/healthcare/files/docs/biosimilars_market_012011_en.pdf. Some of the data and analysis of the mentioned report have been updated to December 2010.
Provenance and peer review: Commissioned; externally peer reviewed.
Authors
Professor Joan Rovira1,3, PhD
Leandro Lindner2, BSc
Emmanuel Giménez1, BSc
Professor Jaime Espín3, PhD
Antonio Olry de Labry3,4, PhD
Leticia García3, BSc
1Universidad de Barcelona
2IMS Consulting Group
3Escuela Andaluza de Salud Pública
4Ciber en Epidemiología y Salud Pública (CIBERESP)
References
1. Nagle PC, Lugo TF, Nicita CA. Defining and characterizing the late-stage biopharmaceutical pipeline. Am J Manag Care. 2003;9(6 Suppl):S124-35.
2. Declerck PJ. Biologicals and biosimilars: a review of the science and its implications. Generics and Biosimilars Initiative Journal (GaBI Journal). 2012;1(1):13-6. doi:10.5639/gabij.2012.0101.005
3. Simoens S. Biosimilar medicines and cost-effectiveness. ClinicoEcon Outcomes Res. 2011;3:29-36.
4. Blackstone EA, Fuhr JP Jr. Innovation and competition: will biosimilars succeed? Biotechnol Healthc. 2012 Spring; 9(1):24-7.
5. Avidor Y, Mabjeesh NJ, Matzkin H. Biotechnology and drug discovery: from bench to bedside. South Med J. 2003;96(12):1174-86.
6. European Medicines Agency [homepage on the Internet]. Questions and answers on biosimilar medicines (similar biological medicinal products). 27 Sep 2012 [cited 2013 Feb 21]. Available from: http://www.emea.europa.eu/pdfs/human/pcwp/7456206en.pdf
7. Höer A, de Millas C, Häussler B, Haustein R. Saving money in the European healthcare systems with biosimilars. Generics and Biosimilars Initiative Journal (GaBI Journal). 2012;1(3-4).120-6. doi:10.5639/gabij.2012.0103-4.036
8. Roger SD, Goldsmith D. Biosimilars: it’s not as simple as cost alone. J Clin Pharm Ther. 2008;33(5):459-64.
9. European Medicines Agency [homepage on the Internet]. Medicines. 2013 [cited 2013 Feb 21]. Available from: http://www.ema.europa.eu
10. IMS MIDAS™ database [data accessed in 2010 and 2011]. Data on file.
11. WHO Collaborating Centre for Drug Statistics Methodology [homepage on the Internet]. ATC/DDD Index. 2013 [cited 2013 Feb 21]. Available from: http://www.whocc.no/atc_ddd_index/
12. European Federation of Pharamaceutical Industries and Associations [homepage on the Internet]. 2013 [cited Feb 21]. Available from: http://www.efpia.eu/
13. European Comission Eurostat [homepage on the Internet]. 2013 [cited Feb 21]. Available from: http://epp.eurostat.ec.europa.eu/portal/page/portal/eurostat/home/
14. World Health Organization [homepage on the Internet]. Countries. 2013 [cited 2013 Feb 21]. Available from: http://www.who.int/countries/en/
15. Grabowski, H. Biologics and data exclusivity: balancing incentives for innovation and cost savings. In: Mattison N, Mestre-Ferrandiz J, Towse A (Eds). Biosimilars: how much entry and price competition will result?. London: OHE, December 2010.
|
Author for correspondence: Antonio Olry de Labry, PhD, Escuela Andaluza de Salud Pública Cuesta del Observatorio, Campus Universitario de Cartuja, ES-18080 Granada, Spain |
Disclosure of Conflict of Interest Statement is available upon request.
Copyright © 2013 Pro Pharma Communications International
Permission granted to reproduce for personal and non-commercial use only. All other reproduction, copy or reprinting of all or part of any ‘Content’ found on this website is strictly prohibited without the prior consent of the publisher. Contact the publisher to obtain permission before redistributing.
Related article
Current status of biopharmaceuticals in Iran’s pharmaceutical market